Honduran vs African GED/Equivalency
COMPARE
Honduran
African
GED/Equivalency
GED/Equivalency Comparison
Hondurans
Africans
79.3%
GED/EQUIVALENCY
0.0/ 100
METRIC RATING
325th/ 347
METRIC RANK
83.4%
GED/EQUIVALENCY
0.5/ 100
METRIC RATING
256th/ 347
METRIC RANK
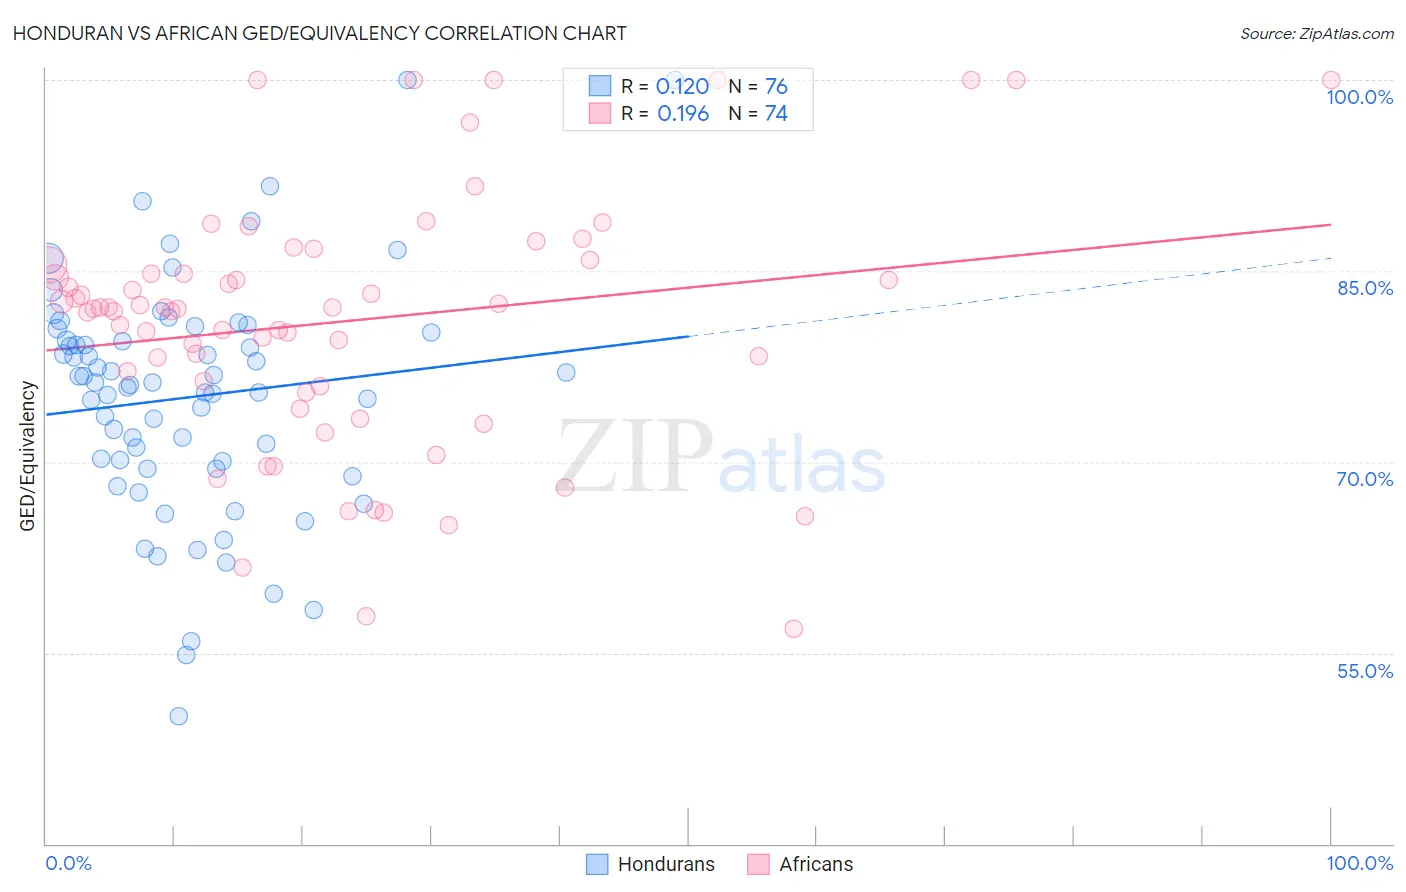
Honduran vs African GED/Equivalency Correlation Chart
The statistical analysis conducted on geographies consisting of 357,858,578 people shows a poor positive correlation between the proportion of Hondurans and percentage of population with at least ged/equivalency education in the United States with a correlation coefficient (R) of 0.120 and weighted average of 79.3%. Similarly, the statistical analysis conducted on geographies consisting of 470,092,963 people shows a poor positive correlation between the proportion of Africans and percentage of population with at least ged/equivalency education in the United States with a correlation coefficient (R) of 0.196 and weighted average of 83.4%, a difference of 5.2%.
GED/Equivalency Correlation Summary
| Measurement | Honduran | African |
| Minimum | 50.0% | 56.9% |
| Maximum | 100.0% | 100.0% |
| Range | 50.0% | 43.1% |
| Mean | 75.1% | 81.0% |
| Median | 76.2% | 82.1% |
| Interquartile 25% (IQ1) | 69.8% | 75.9% |
| Interquartile 75% (IQ3) | 79.8% | 85.5% |
| Interquartile Range (IQR) | 10.1% | 9.6% |
| Standard Deviation (Sample) | 9.2% | 9.9% |
| Standard Deviation (Population) | 9.1% | 9.8% |
Similar Demographics by GED/Equivalency
Demographics Similar to Hondurans by GED/Equivalency
In terms of ged/equivalency, the demographic groups most similar to Hondurans are Yuman (79.2%, a difference of 0.090%), Central American (79.2%, a difference of 0.11%), Mexican American Indian (79.4%, a difference of 0.12%), Hispanic or Latino (79.1%, a difference of 0.22%), and Dominican (79.1%, a difference of 0.27%).
| Demographics | Rating | Rank | GED/Equivalency |
| Yaqui | 0.0 /100 | #318 | Tragic 80.5% |
| Immigrants | Belize | 0.0 /100 | #319 | Tragic 80.5% |
| Immigrants | Cuba | 0.0 /100 | #320 | Tragic 80.2% |
| Yup'ik | 0.0 /100 | #321 | Tragic 80.0% |
| Lumbee | 0.0 /100 | #322 | Tragic 80.0% |
| Immigrants | Nicaragua | 0.0 /100 | #323 | Tragic 79.9% |
| Mexican American Indians | 0.0 /100 | #324 | Tragic 79.4% |
| Hondurans | 0.0 /100 | #325 | Tragic 79.3% |
| Yuman | 0.0 /100 | #326 | Tragic 79.2% |
| Central Americans | 0.0 /100 | #327 | Tragic 79.2% |
| Hispanics or Latinos | 0.0 /100 | #328 | Tragic 79.1% |
| Dominicans | 0.0 /100 | #329 | Tragic 79.1% |
| Immigrants | Cabo Verde | 0.0 /100 | #330 | Tragic 78.9% |
| Immigrants | Honduras | 0.0 /100 | #331 | Tragic 78.7% |
| Immigrants | Azores | 0.0 /100 | #332 | Tragic 78.7% |
Demographics Similar to Africans by GED/Equivalency
In terms of ged/equivalency, the demographic groups most similar to Africans are Colville (83.4%, a difference of 0.010%), Jamaican (83.3%, a difference of 0.13%), Malaysian (83.3%, a difference of 0.16%), Creek (83.6%, a difference of 0.18%), and Comanche (83.6%, a difference of 0.20%).
| Demographics | Rating | Rank | GED/Equivalency |
| Crow | 1.1 /100 | #249 | Tragic 83.8% |
| Shoshone | 1.0 /100 | #250 | Tragic 83.7% |
| Spanish Americans | 0.8 /100 | #251 | Tragic 83.6% |
| Bahamians | 0.8 /100 | #252 | Tragic 83.6% |
| Comanche | 0.7 /100 | #253 | Tragic 83.6% |
| Creek | 0.7 /100 | #254 | Tragic 83.6% |
| Colville | 0.5 /100 | #255 | Tragic 83.4% |
| Africans | 0.5 /100 | #256 | Tragic 83.4% |
| Jamaicans | 0.4 /100 | #257 | Tragic 83.3% |
| Malaysians | 0.4 /100 | #258 | Tragic 83.3% |
| Immigrants | Vietnam | 0.3 /100 | #259 | Tragic 83.2% |
| Choctaw | 0.3 /100 | #260 | Tragic 83.1% |
| Inupiat | 0.2 /100 | #261 | Tragic 83.1% |
| Immigrants | Armenia | 0.2 /100 | #262 | Tragic 83.1% |
| Immigrants | Congo | 0.2 /100 | #263 | Tragic 83.1% |