Immigrants from Guyana vs Immigrants from Somalia GED/Equivalency

COMPARE

Immigrants from Guyana
Race
Ancestry
AfghanAfricanAlaska NativeAlaskan AthabascanAlbanianAleutAlsatianAmericanApacheArabArapahoArgentineanArmenianAssyrian/Chaldean/SyriacAustralianAustrianBahamianBangladeshiBarbadianBasqueBelgianBelizeanBermudanBhutaneseBlackfeetBolivianBrazilianBritishBritish West IndianBulgarianBurmeseCajunCambodianCanadianCape VerdeanCarpatho RusynCelticCentral AmericanCentral American IndianCherokeeCheyenneChickasawChileanChineseChippewaChoctawColombianColvilleComancheCosta RicanCreeCreekCroatianCrowCubanCypriotCzechCzechoslovakianDanishDelawareDominicanDutchDutch West IndianEastern EuropeanEcuadorianEgyptianEnglishEstonianEthiopianEuropeanFijianFilipinoFinnishFrenchFrench American IndianFrench CanadianGermanGerman RussianGhanaianGreekGuamanian/ChamorroGuatemalanGuyaneseHaitianHmongHonduranHopiHoumaHungarianIcelanderIndian (Asian)IndonesianInupiatIranianIraqiIrishIroquoisIsraeliItalianJamaicanJapaneseJordanianKenyanKiowaKoreanLaotianLatvianLebaneseLiberianLithuanianLumbeeLuxembourgerMacedonianMalaysianMalteseMarshalleseMenomineeMexicanMexican American IndianMongolianMoroccanNative HawaiianNavajoNepaleseNew ZealanderNicaraguanNigerianNorthern EuropeanNorwegianOkinawanOsageOttawaPaiutePakistaniPalestinianPanamanianParaguayanPennsylvania GermanPeruvianPimaPolishPortuguesePotawatomiPuebloPuerto RicanPuget Sound SalishRomanianRussianSalvadoranSamoanScandinavianScotch-IrishScottishSeminoleSenegaleseSerbianShoshoneSierra LeoneanSiouxSlavicSlovakSloveneSomaliSouth AfricanSouth AmericanSouth American IndianSoviet UnionSpaniardSpanishSpanish AmericanSpanish American IndianSri LankanSubsaharan AfricanSudaneseSwedishSwissSyrianTaiwaneseThaiTlingit-HaidaTohono O'OdhamTonganTrinidadian and TobagonianTsimshianTurkishU.S. Virgin IslanderUgandanUkrainianUruguayanUteVenezuelanVietnameseWelshWest IndianYakamaYaquiYugoslavianYumanYup'ikZimbabwean
Immigration
NonimmigrantsImmigrantsAfghanistanAfricaAlbaniaArgentinaArmeniaAsiaAustraliaAustriaBahamasBangladeshBarbadosBelarusBelgiumBelizeBoliviaBosnia and HerzegovinaBrazilBulgariaBurma/MyanmarCabo VerdeCambodiaCameroonCanadaCaribbeanCentral AmericaChileChinaColombiaCongoCosta RicaCroatiaCubaCzechoslovakiaDenmarkDominicaDominican RepublicEastern AfricaEastern AsiaEastern EuropeEcuadorEgyptEl SalvadorEnglandEritreaEthiopiaEuropeFijiFranceGermanyGhanaGreeceGrenadaGuatemalaGuyanaHaitiHondurasHong KongHungaryIndiaIndonesiaIranIraqIrelandIsraelItalyJamaicaJapanJordanKazakhstanKenyaKoreaKuwaitLaosLatin AmericaLatviaLebanonLiberiaLithuaniaMalaysiaMexicoMicronesiaMiddle AfricaMoldovaMoroccoNepalNetherlandsNicaraguaNigeriaNorth AmericaNorth MacedoniaNorthern AfricaNorthern EuropeNorwayOceaniaPakistanPanamaPeruPhilippinesPolandPortugalRomaniaRussiaSaudi ArabiaScotlandSenegalSerbiaSierra LeoneSingaporeSouth AfricaSouth AmericaSouth Central AsiaSouth Eastern AsiaSouthern EuropeSpainSri LankaSt. Vincent and the GrenadinesSudanSwedenSwitzerlandSyriaTaiwanThailandTrinidad and TobagoTurkeyUgandaUkraineUruguayUzbekistanVenezuelaVietnamWest IndiesWestern AfricaWestern AsiaWestern EuropeYemenZaireZimbabweAzores
Immigrants from Somalia
Race
Ancestry
AfghanAfricanAlaska NativeAlaskan AthabascanAlbanianAleutAlsatianAmericanApacheArabArapahoArgentineanArmenianAssyrian/Chaldean/SyriacAustralianAustrianBahamianBangladeshiBarbadianBasqueBelgianBelizeanBermudanBhutaneseBlackfeetBolivianBrazilianBritishBritish West IndianBulgarianBurmeseCajunCambodianCanadianCape VerdeanCarpatho RusynCelticCentral AmericanCentral American IndianCherokeeCheyenneChickasawChileanChineseChippewaChoctawColombianColvilleComancheCosta RicanCreeCreekCroatianCrowCubanCypriotCzechCzechoslovakianDanishDelawareDominicanDutchDutch West IndianEastern EuropeanEcuadorianEgyptianEnglishEstonianEthiopianEuropeanFijianFilipinoFinnishFrenchFrench American IndianFrench CanadianGermanGerman RussianGhanaianGreekGuamanian/ChamorroGuatemalanGuyaneseHaitianHmongHonduranHopiHoumaHungarianIcelanderIndian (Asian)IndonesianInupiatIranianIraqiIrishIroquoisIsraeliItalianJamaicanJapaneseJordanianKenyanKiowaKoreanLaotianLatvianLebaneseLiberianLithuanianLumbeeLuxembourgerMacedonianMalaysianMalteseMarshalleseMenomineeMexicanMexican American IndianMongolianMoroccanNative HawaiianNavajoNepaleseNew ZealanderNicaraguanNigerianNorthern EuropeanNorwegianOkinawanOsageOttawaPaiutePakistaniPalestinianPanamanianParaguayanPennsylvania GermanPeruvianPimaPolishPortuguesePotawatomiPuebloPuerto RicanPuget Sound SalishRomanianRussianSalvadoranSamoanScandinavianScotch-IrishScottishSeminoleSenegaleseSerbianShoshoneSierra LeoneanSiouxSlavicSlovakSloveneSomaliSouth AfricanSouth AmericanSouth American IndianSoviet UnionSpaniardSpanishSpanish AmericanSpanish American IndianSri LankanSubsaharan AfricanSudaneseSwedishSwissSyrianTaiwaneseThaiTlingit-HaidaTohono O'OdhamTonganTrinidadian and TobagonianTsimshianTurkishU.S. Virgin IslanderUgandanUkrainianUruguayanUteVenezuelanVietnameseWelshWest IndianYakamaYaquiYugoslavianYumanYup'ikZimbabwean
Immigration
NonimmigrantsImmigrantsAfghanistanAfricaAlbaniaArgentinaArmeniaAsiaAustraliaAustriaBahamasBangladeshBarbadosBelarusBelgiumBelizeBoliviaBosnia and HerzegovinaBrazilBulgariaBurma/MyanmarCabo VerdeCambodiaCameroonCanadaCaribbeanCentral AmericaChileChinaColombiaCongoCosta RicaCroatiaCubaCzechoslovakiaDenmarkDominicaDominican RepublicEastern AfricaEastern AsiaEastern EuropeEcuadorEgyptEl SalvadorEnglandEritreaEthiopiaEuropeFijiFranceGermanyGhanaGreeceGrenadaGuatemalaHaitiHondurasHong KongHungaryIndiaIndonesiaIranIraqIrelandIsraelItalyJamaicaJapanJordanKazakhstanKenyaKoreaKuwaitLaosLatin AmericaLatviaLebanonLiberiaLithuaniaMalaysiaMexicoMicronesiaMiddle AfricaMoldovaMoroccoNepalNetherlandsNicaraguaNigeriaNorth AmericaNorth MacedoniaNorthern AfricaNorthern EuropeNorwayOceaniaPakistanPanamaPeruPhilippinesPolandPortugalRomaniaRussiaSaudi ArabiaScotlandSenegalSerbiaSierra LeoneSingaporeSomaliaSouth AfricaSouth AmericaSouth Central AsiaSouth Eastern AsiaSouthern EuropeSpainSri LankaSt. Vincent and the GrenadinesSudanSwedenSwitzerlandSyriaTaiwanThailandTrinidad and TobagoTurkeyUgandaUkraineUruguayUzbekistanVenezuelaVietnamWest IndiesWestern AfricaWestern AsiaWestern EuropeYemenZaireZimbabweAzores
GED/Equivalency
Income
Poverty
Unemployment
Labor Participation
Family Structure
Vehicle Availability
Education Level
Disability

GED/Equivalency Comparison

Immigrants from Guyana

Immigrants from Somalia

Tragic
Poor
81.0%
GED/EQUIVALENCY
0.0/ 100
METRIC RATING
310th/ 347
METRIC RANK
84.8%
GED/EQUIVALENCY
10.6/ 100
METRIC RATING
212th/ 347
METRIC RANK

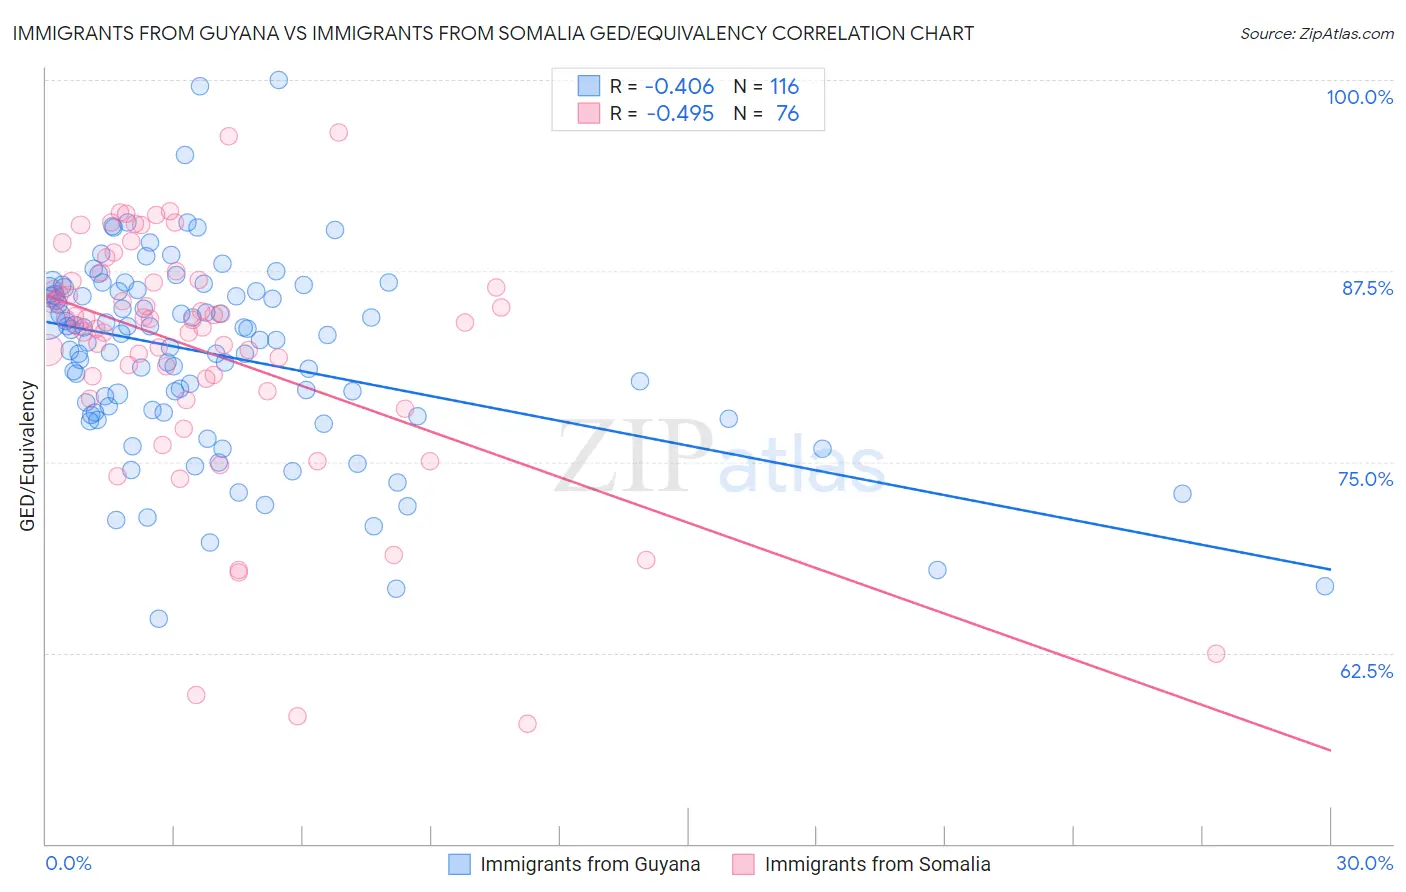
Immigrants from Guyana vs Immigrants from Somalia GED/Equivalency Correlation Chart

The statistical analysis conducted on geographies consisting of 183,746,342 people shows a moderate negative correlation between the proportion of Immigrants from Guyana and percentage of population with at least ged/equivalency education in the United States with a correlation coefficient (R) of -0.406 and weighted average of 81.0%. Similarly, the statistical analysis conducted on geographies consisting of 92,111,755 people shows a moderate negative correlation between the proportion of Immigrants from Somalia and percentage of population with at least ged/equivalency education in the United States with a correlation coefficient (R) of -0.495 and weighted average of 84.8%, a difference of 4.8%.
Immigrants from Guyana vs Immigrants from Somalia GED/Equivalency

GED/Equivalency Correlation Summary

MeasurementImmigrants from GuyanaImmigrants from Somalia
Minimum64.8%57.9%
Maximum100.0%96.6%
Range35.2%38.7%
Mean82.0%82.3%
Median83.1%84.2%
Interquartile 25% (IQ1)78.3%80.0%
Interquartile 75% (IQ3)86.2%86.8%
Interquartile Range (IQR)7.9%6.8%
Standard Deviation (Sample)6.3%8.0%
Standard Deviation (Population)6.2%7.9%

Similar Demographics by GED/Equivalency

Demographics Similar to Immigrants from Guyana by GED/Equivalency

In terms of ged/equivalency, the demographic groups most similar to Immigrants from Guyana are Native/Alaskan (80.9%, a difference of 0.0%), Nicaraguan (80.9%, a difference of 0.040%), Cape Verdean (80.9%, a difference of 0.040%), Immigrants from Ecuador (81.0%, a difference of 0.060%), and Belizean (80.9%, a difference of 0.060%).
DemographicsRating | RankGED/Equivalency
Immigrants | Portugal
0.0
/100
|
#303
Tragic
81.6%
Navajo
0.0
/100
|
#304
Tragic
81.5%
Immigrants | Grenada
0.0
/100
|
#305
Tragic
81.3%
Guyanese
0.0
/100
|
#306
Tragic
81.3%
Immigrants | Dominica
0.0
/100
|
#307
Tragic
81.1%
Puerto Ricans
0.0
/100
|
#308
Tragic
81.1%
Immigrants | Ecuador
0.0
/100
|
#309
Tragic
81.0%
Immigrants | Guyana
0.0
/100
|
#310
Tragic
81.0%
Natives/Alaskans
0.0
/100
|
#311
Tragic
80.9%
Nicaraguans
0.0
/100
|
#312
Tragic
80.9%
Cape Verdeans
0.0
/100
|
#313
Tragic
80.9%
Belizeans
0.0
/100
|
#314
Tragic
80.9%
Apache
0.0
/100
|
#315
Tragic
80.7%
Central American Indians
0.0
/100
|
#316
Tragic
80.6%
Immigrants | Caribbean
0.0
/100
|
#317
Tragic
80.5%

Demographics Similar to Immigrants from Somalia by GED/Equivalency

In terms of ged/equivalency, the demographic groups most similar to Immigrants from Somalia are South American (84.8%, a difference of 0.020%), Immigrants from Philippines (84.8%, a difference of 0.030%), Osage (84.8%, a difference of 0.060%), Immigrants from Cameroon (84.9%, a difference of 0.080%), and Peruvian (84.7%, a difference of 0.080%).
DemographicsRating | RankGED/Equivalency
Liberians
14.6
/100
|
#205
Poor
85.0%
Samoans
13.7
/100
|
#206
Poor
84.9%
Hmong
13.1
/100
|
#207
Poor
84.9%
Marshallese
12.5
/100
|
#208
Poor
84.9%
Colombians
12.3
/100
|
#209
Poor
84.9%
Immigrants | Cameroon
12.1
/100
|
#210
Poor
84.9%
South Americans
10.9
/100
|
#211
Poor
84.8%
Immigrants | Somalia
10.6
/100
|
#212
Poor
84.8%
Immigrants | Philippines
10.0
/100
|
#213
Poor
84.8%
Osage
9.5
/100
|
#214
Tragic
84.8%
Peruvians
9.2
/100
|
#215
Tragic
84.7%
Immigrants | Micronesia
8.7
/100
|
#216
Tragic
84.7%
Nigerians
8.6
/100
|
#217
Tragic
84.7%
Alaska Natives
8.6
/100
|
#218
Tragic
84.7%
Potawatomi
8.2
/100
|
#219
Tragic
84.7%