Jamaican vs Immigrants from Somalia GED/Equivalency
COMPARE
Jamaican
Immigrants from Somalia
GED/Equivalency
GED/Equivalency Comparison
Jamaicans
Immigrants from Somalia
83.3%
GED/EQUIVALENCY
0.4/ 100
METRIC RATING
257th/ 347
METRIC RANK
84.8%
GED/EQUIVALENCY
10.6/ 100
METRIC RATING
212th/ 347
METRIC RANK
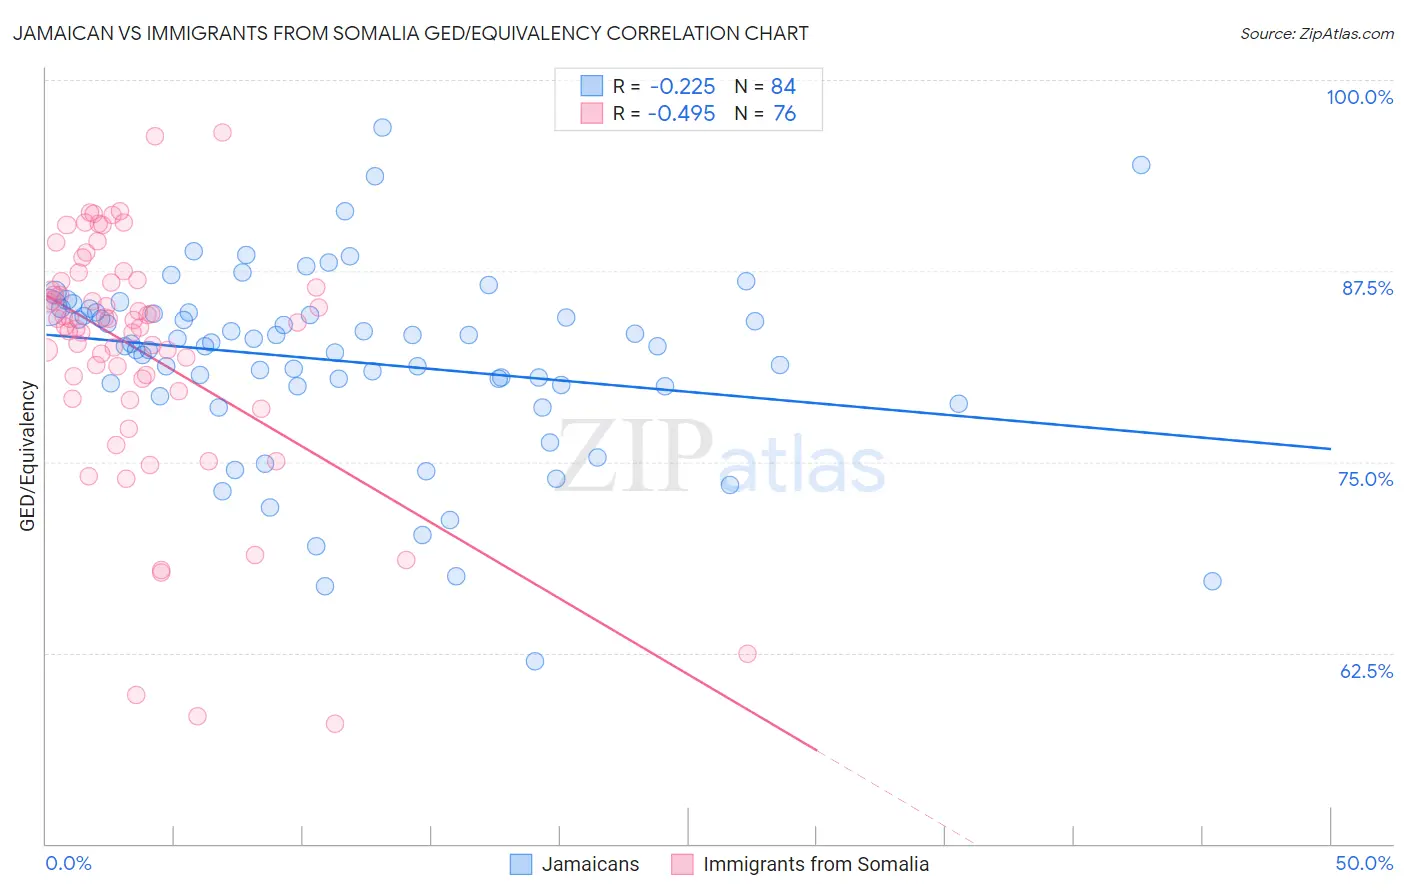
Jamaican vs Immigrants from Somalia GED/Equivalency Correlation Chart
The statistical analysis conducted on geographies consisting of 368,084,562 people shows a weak negative correlation between the proportion of Jamaicans and percentage of population with at least ged/equivalency education in the United States with a correlation coefficient (R) of -0.225 and weighted average of 83.3%. Similarly, the statistical analysis conducted on geographies consisting of 92,111,755 people shows a moderate negative correlation between the proportion of Immigrants from Somalia and percentage of population with at least ged/equivalency education in the United States with a correlation coefficient (R) of -0.495 and weighted average of 84.8%, a difference of 1.8%.
GED/Equivalency Correlation Summary
| Measurement | Jamaican | Immigrants from Somalia |
| Minimum | 61.9% | 57.9% |
| Maximum | 96.9% | 96.6% |
| Range | 35.0% | 38.7% |
| Mean | 81.6% | 82.3% |
| Median | 82.7% | 84.2% |
| Interquartile 25% (IQ1) | 80.0% | 80.0% |
| Interquartile 75% (IQ3) | 84.8% | 86.8% |
| Interquartile Range (IQR) | 4.8% | 6.8% |
| Standard Deviation (Sample) | 6.2% | 8.0% |
| Standard Deviation (Population) | 6.1% | 7.9% |
Similar Demographics by GED/Equivalency
Demographics Similar to Jamaicans by GED/Equivalency
In terms of ged/equivalency, the demographic groups most similar to Jamaicans are Malaysian (83.3%, a difference of 0.030%), African (83.4%, a difference of 0.13%), Colville (83.4%, a difference of 0.14%), Immigrants from Vietnam (83.2%, a difference of 0.17%), and Choctaw (83.1%, a difference of 0.20%).
| Demographics | Rating | Rank | GED/Equivalency |
| Shoshone | 1.0 /100 | #250 | Tragic 83.7% |
| Spanish Americans | 0.8 /100 | #251 | Tragic 83.6% |
| Bahamians | 0.8 /100 | #252 | Tragic 83.6% |
| Comanche | 0.7 /100 | #253 | Tragic 83.6% |
| Creek | 0.7 /100 | #254 | Tragic 83.6% |
| Colville | 0.5 /100 | #255 | Tragic 83.4% |
| Africans | 0.5 /100 | #256 | Tragic 83.4% |
| Jamaicans | 0.4 /100 | #257 | Tragic 83.3% |
| Malaysians | 0.4 /100 | #258 | Tragic 83.3% |
| Immigrants | Vietnam | 0.3 /100 | #259 | Tragic 83.2% |
| Choctaw | 0.3 /100 | #260 | Tragic 83.1% |
| Inupiat | 0.2 /100 | #261 | Tragic 83.1% |
| Immigrants | Armenia | 0.2 /100 | #262 | Tragic 83.1% |
| Immigrants | Congo | 0.2 /100 | #263 | Tragic 83.1% |
| Bangladeshis | 0.2 /100 | #264 | Tragic 83.1% |
Demographics Similar to Immigrants from Somalia by GED/Equivalency
In terms of ged/equivalency, the demographic groups most similar to Immigrants from Somalia are South American (84.8%, a difference of 0.020%), Immigrants from Philippines (84.8%, a difference of 0.030%), Osage (84.8%, a difference of 0.060%), Immigrants from Cameroon (84.9%, a difference of 0.080%), and Peruvian (84.7%, a difference of 0.080%).
| Demographics | Rating | Rank | GED/Equivalency |
| Liberians | 14.6 /100 | #205 | Poor 85.0% |
| Samoans | 13.7 /100 | #206 | Poor 84.9% |
| Hmong | 13.1 /100 | #207 | Poor 84.9% |
| Marshallese | 12.5 /100 | #208 | Poor 84.9% |
| Colombians | 12.3 /100 | #209 | Poor 84.9% |
| Immigrants | Cameroon | 12.1 /100 | #210 | Poor 84.9% |
| South Americans | 10.9 /100 | #211 | Poor 84.8% |
| Immigrants | Somalia | 10.6 /100 | #212 | Poor 84.8% |
| Immigrants | Philippines | 10.0 /100 | #213 | Poor 84.8% |
| Osage | 9.5 /100 | #214 | Tragic 84.8% |
| Peruvians | 9.2 /100 | #215 | Tragic 84.7% |
| Immigrants | Micronesia | 8.7 /100 | #216 | Tragic 84.7% |
| Nigerians | 8.6 /100 | #217 | Tragic 84.7% |
| Alaska Natives | 8.6 /100 | #218 | Tragic 84.7% |
| Potawatomi | 8.2 /100 | #219 | Tragic 84.7% |