Immigrants from Morocco vs Immigrants from Guatemala College, Under 1 year
COMPARE
Immigrants from Morocco
Immigrants from Guatemala
College, Under 1 year
College, Under 1 year Comparison
Immigrants from Morocco
Immigrants from Guatemala
66.5%
COLLEGE, UNDER 1 YEAR
81.7/ 100
METRIC RATING
147th/ 347
METRIC RANK
56.2%
COLLEGE, UNDER 1 YEAR
0.0/ 100
METRIC RATING
327th/ 347
METRIC RANK
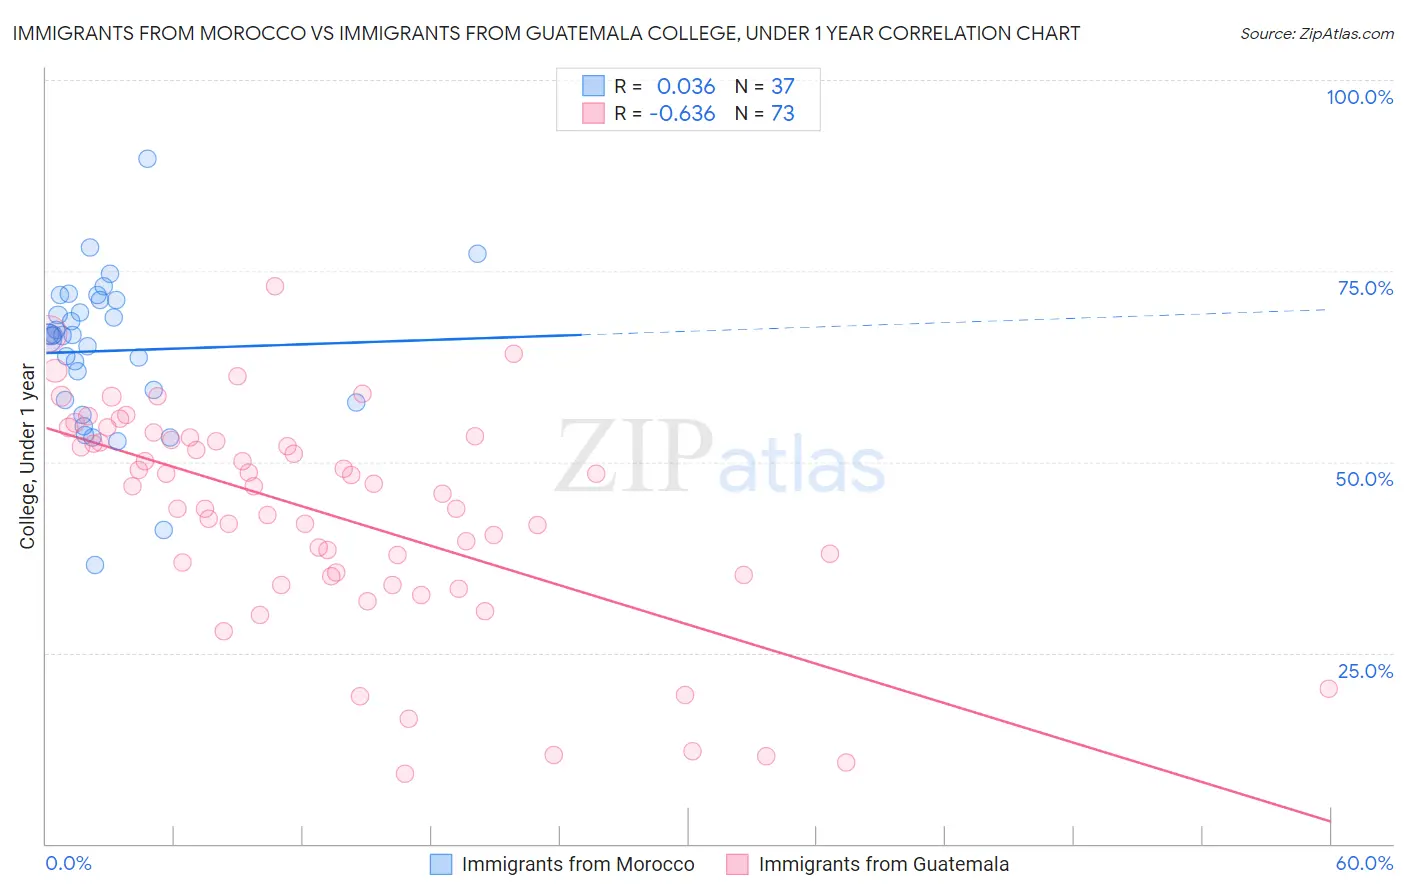
Immigrants from Morocco vs Immigrants from Guatemala College, Under 1 year Correlation Chart
The statistical analysis conducted on geographies consisting of 178,912,438 people shows no correlation between the proportion of Immigrants from Morocco and percentage of population with at least college, under 1 year education in the United States with a correlation coefficient (R) of 0.036 and weighted average of 66.5%. Similarly, the statistical analysis conducted on geographies consisting of 377,285,561 people shows a significant negative correlation between the proportion of Immigrants from Guatemala and percentage of population with at least college, under 1 year education in the United States with a correlation coefficient (R) of -0.636 and weighted average of 56.2%, a difference of 18.3%.
College, Under 1 year Correlation Summary
| Measurement | Immigrants from Morocco | Immigrants from Guatemala |
| Minimum | 36.5% | 9.2% |
| Maximum | 89.7% | 73.0% |
| Range | 53.2% | 63.8% |
| Mean | 64.5% | 43.2% |
| Median | 66.5% | 46.8% |
| Interquartile 25% (IQ1) | 58.0% | 35.1% |
| Interquartile 75% (IQ3) | 71.2% | 53.1% |
| Interquartile Range (IQR) | 13.2% | 18.0% |
| Standard Deviation (Sample) | 10.1% | 14.3% |
| Standard Deviation (Population) | 9.9% | 14.2% |
Similar Demographics by College, Under 1 year
Demographics Similar to Immigrants from Morocco by College, Under 1 year
In terms of college, under 1 year, the demographic groups most similar to Immigrants from Morocco are Kenyan (66.5%, a difference of 0.0%), Immigrants from Kenya (66.5%, a difference of 0.010%), Immigrants from Germany (66.5%, a difference of 0.020%), Immigrants from Uganda (66.5%, a difference of 0.080%), and English (66.6%, a difference of 0.090%).
| Demographics | Rating | Rank | College, Under 1 year |
| Slavs | 85.9 /100 | #140 | Excellent 66.7% |
| Immigrants | Afghanistan | 85.1 /100 | #141 | Excellent 66.7% |
| English | 82.9 /100 | #142 | Excellent 66.6% |
| Immigrants | Uganda | 82.8 /100 | #143 | Excellent 66.5% |
| Immigrants | Germany | 82.0 /100 | #144 | Excellent 66.5% |
| Immigrants | Kenya | 81.8 /100 | #145 | Excellent 66.5% |
| Kenyans | 81.7 /100 | #146 | Excellent 66.5% |
| Immigrants | Morocco | 81.7 /100 | #147 | Excellent 66.5% |
| Taiwanese | 78.6 /100 | #148 | Good 66.4% |
| Immigrants | Venezuela | 77.9 /100 | #149 | Good 66.3% |
| Immigrants | Iraq | 77.1 /100 | #150 | Good 66.3% |
| Immigrants | Sudan | 76.0 /100 | #151 | Good 66.2% |
| Sudanese | 74.1 /100 | #152 | Good 66.2% |
| Belgians | 73.7 /100 | #153 | Good 66.2% |
| Immigrants | Eritrea | 71.9 /100 | #154 | Good 66.1% |
Demographics Similar to Immigrants from Guatemala by College, Under 1 year
In terms of college, under 1 year, the demographic groups most similar to Immigrants from Guatemala are Navajo (56.3%, a difference of 0.090%), Immigrants from Latin America (56.3%, a difference of 0.24%), Cape Verdean (56.0%, a difference of 0.29%), Immigrants from El Salvador (56.4%, a difference of 0.34%), and Immigrants from Honduras (56.5%, a difference of 0.47%).
| Demographics | Rating | Rank | College, Under 1 year |
| Guatemalans | 0.0 /100 | #320 | Tragic 56.8% |
| Natives/Alaskans | 0.0 /100 | #321 | Tragic 56.6% |
| Immigrants | Caribbean | 0.0 /100 | #322 | Tragic 56.6% |
| Immigrants | Honduras | 0.0 /100 | #323 | Tragic 56.5% |
| Immigrants | El Salvador | 0.0 /100 | #324 | Tragic 56.4% |
| Immigrants | Latin America | 0.0 /100 | #325 | Tragic 56.3% |
| Navajo | 0.0 /100 | #326 | Tragic 56.3% |
| Immigrants | Guatemala | 0.0 /100 | #327 | Tragic 56.2% |
| Cape Verdeans | 0.0 /100 | #328 | Tragic 56.0% |
| Immigrants | Cuba | 0.0 /100 | #329 | Tragic 55.7% |
| Mexicans | 0.0 /100 | #330 | Tragic 55.6% |
| Dominicans | 0.0 /100 | #331 | Tragic 55.5% |
| Immigrants | Yemen | 0.0 /100 | #332 | Tragic 55.3% |
| Yuman | 0.0 /100 | #333 | Tragic 55.1% |
| Immigrants | Azores | 0.0 /100 | #334 | Tragic 54.7% |