Immigrants from Morocco vs Immigrants from Scotland College, Under 1 year
COMPARE
Immigrants from Morocco
Immigrants from Scotland
College, Under 1 year
College, Under 1 year Comparison
Immigrants from Morocco
Immigrants from Scotland
66.5%
COLLEGE, UNDER 1 YEAR
81.7/ 100
METRIC RATING
147th/ 347
METRIC RANK
69.4%
COLLEGE, UNDER 1 YEAR
99.6/ 100
METRIC RATING
56th/ 347
METRIC RANK
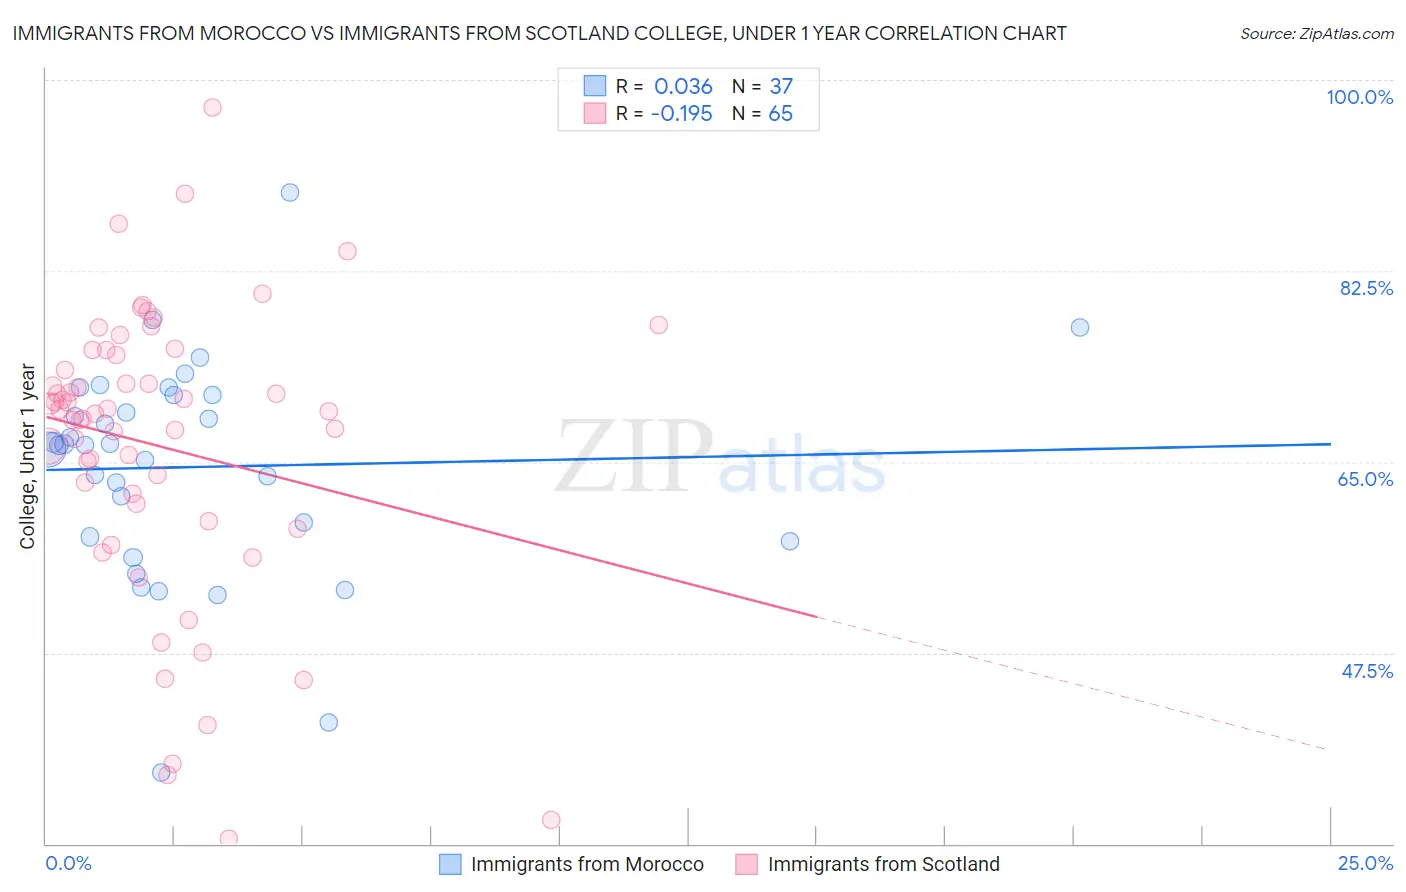
Immigrants from Morocco vs Immigrants from Scotland College, Under 1 year Correlation Chart
The statistical analysis conducted on geographies consisting of 178,912,438 people shows no correlation between the proportion of Immigrants from Morocco and percentage of population with at least college, under 1 year education in the United States with a correlation coefficient (R) of 0.036 and weighted average of 66.5%. Similarly, the statistical analysis conducted on geographies consisting of 196,397,263 people shows a poor negative correlation between the proportion of Immigrants from Scotland and percentage of population with at least college, under 1 year education in the United States with a correlation coefficient (R) of -0.195 and weighted average of 69.4%, a difference of 4.4%.
College, Under 1 year Correlation Summary
| Measurement | Immigrants from Morocco | Immigrants from Scotland |
| Minimum | 36.5% | 30.5% |
| Maximum | 89.7% | 97.4% |
| Range | 53.2% | 66.9% |
| Mean | 64.5% | 66.4% |
| Median | 66.5% | 69.7% |
| Interquartile 25% (IQ1) | 58.0% | 60.3% |
| Interquartile 75% (IQ3) | 71.2% | 75.1% |
| Interquartile Range (IQR) | 13.2% | 14.7% |
| Standard Deviation (Sample) | 10.1% | 13.4% |
| Standard Deviation (Population) | 9.9% | 13.3% |
Similar Demographics by College, Under 1 year
Demographics Similar to Immigrants from Morocco by College, Under 1 year
In terms of college, under 1 year, the demographic groups most similar to Immigrants from Morocco are Kenyan (66.5%, a difference of 0.0%), Immigrants from Kenya (66.5%, a difference of 0.010%), Immigrants from Germany (66.5%, a difference of 0.020%), Immigrants from Uganda (66.5%, a difference of 0.080%), and English (66.6%, a difference of 0.090%).
| Demographics | Rating | Rank | College, Under 1 year |
| Slavs | 85.9 /100 | #140 | Excellent 66.7% |
| Immigrants | Afghanistan | 85.1 /100 | #141 | Excellent 66.7% |
| English | 82.9 /100 | #142 | Excellent 66.6% |
| Immigrants | Uganda | 82.8 /100 | #143 | Excellent 66.5% |
| Immigrants | Germany | 82.0 /100 | #144 | Excellent 66.5% |
| Immigrants | Kenya | 81.8 /100 | #145 | Excellent 66.5% |
| Kenyans | 81.7 /100 | #146 | Excellent 66.5% |
| Immigrants | Morocco | 81.7 /100 | #147 | Excellent 66.5% |
| Taiwanese | 78.6 /100 | #148 | Good 66.4% |
| Immigrants | Venezuela | 77.9 /100 | #149 | Good 66.3% |
| Immigrants | Iraq | 77.1 /100 | #150 | Good 66.3% |
| Immigrants | Sudan | 76.0 /100 | #151 | Good 66.2% |
| Sudanese | 74.1 /100 | #152 | Good 66.2% |
| Belgians | 73.7 /100 | #153 | Good 66.2% |
| Immigrants | Eritrea | 71.9 /100 | #154 | Good 66.1% |
Demographics Similar to Immigrants from Scotland by College, Under 1 year
In terms of college, under 1 year, the demographic groups most similar to Immigrants from Scotland are Asian (69.4%, a difference of 0.020%), Maltese (69.5%, a difference of 0.12%), Immigrants from Malaysia (69.3%, a difference of 0.12%), Immigrants from Czechoslovakia (69.6%, a difference of 0.22%), and Immigrants from Serbia (69.3%, a difference of 0.25%).
| Demographics | Rating | Rank | College, Under 1 year |
| Immigrants | Austria | 99.8 /100 | #49 | Exceptional 70.0% |
| Zimbabweans | 99.8 /100 | #50 | Exceptional 69.9% |
| Mongolians | 99.8 /100 | #51 | Exceptional 69.9% |
| Immigrants | Russia | 99.8 /100 | #52 | Exceptional 69.9% |
| South Africans | 99.7 /100 | #53 | Exceptional 69.7% |
| Immigrants | Czechoslovakia | 99.7 /100 | #54 | Exceptional 69.6% |
| Maltese | 99.7 /100 | #55 | Exceptional 69.5% |
| Immigrants | Scotland | 99.6 /100 | #56 | Exceptional 69.4% |
| Asians | 99.6 /100 | #57 | Exceptional 69.4% |
| Immigrants | Malaysia | 99.6 /100 | #58 | Exceptional 69.3% |
| Immigrants | Serbia | 99.5 /100 | #59 | Exceptional 69.3% |
| Immigrants | Asia | 99.5 /100 | #60 | Exceptional 69.2% |
| Immigrants | Kazakhstan | 99.5 /100 | #61 | Exceptional 69.2% |
| Immigrants | Belarus | 99.5 /100 | #62 | Exceptional 69.2% |
| Immigrants | Canada | 99.4 /100 | #63 | Exceptional 69.1% |