Immigrants from Morocco vs Somali College, Under 1 year
COMPARE
Immigrants from Morocco
Somali
College, Under 1 year
College, Under 1 year Comparison
Immigrants from Morocco
Somalis
66.5%
COLLEGE, UNDER 1 YEAR
81.7/ 100
METRIC RATING
147th/ 347
METRIC RANK
65.8%
COLLEGE, UNDER 1 YEAR
62.7/ 100
METRIC RATING
163rd/ 347
METRIC RANK
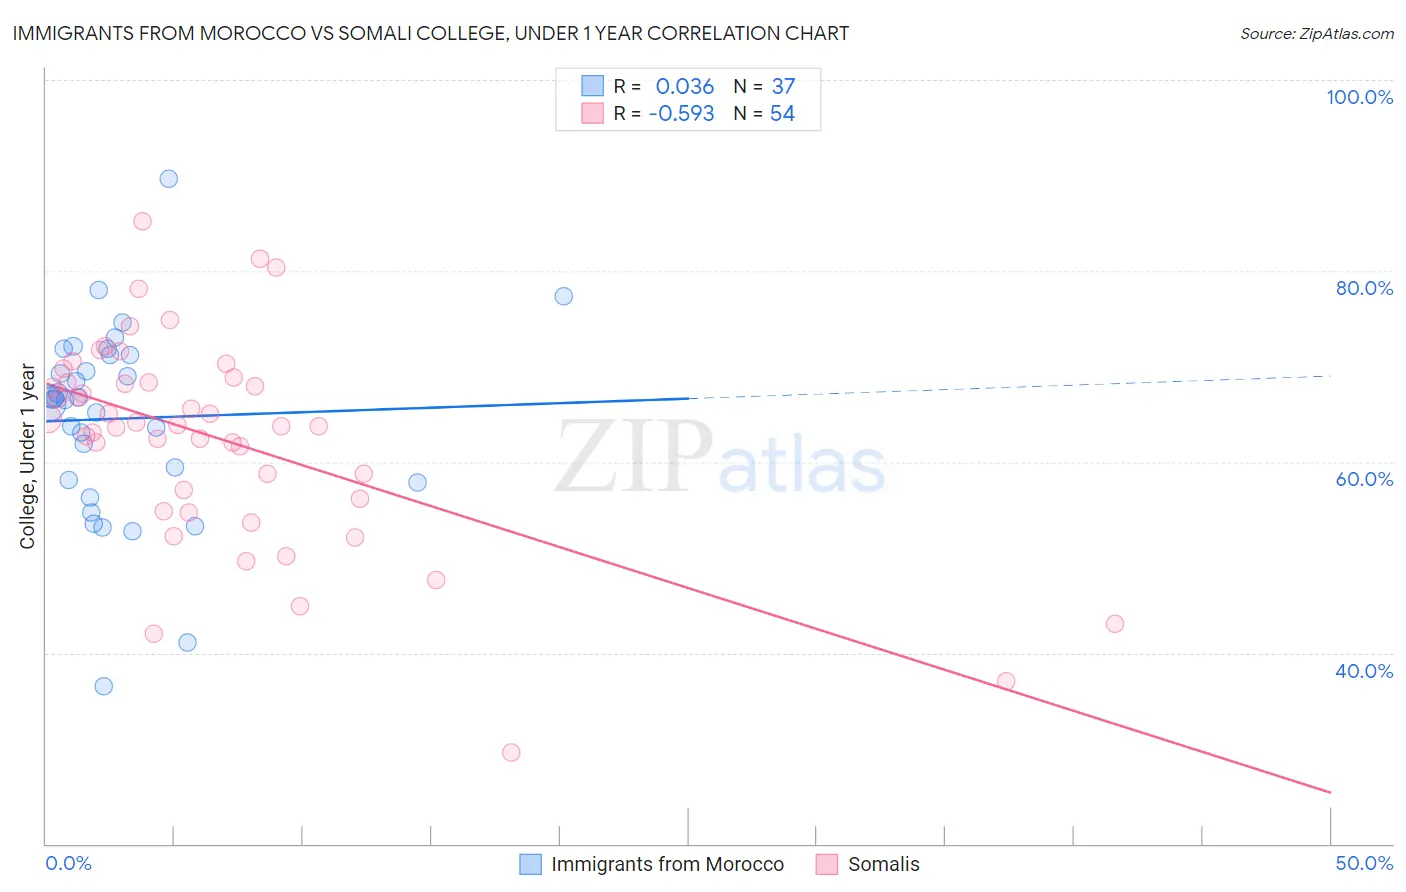
Immigrants from Morocco vs Somali College, Under 1 year Correlation Chart
The statistical analysis conducted on geographies consisting of 178,912,438 people shows no correlation between the proportion of Immigrants from Morocco and percentage of population with at least college, under 1 year education in the United States with a correlation coefficient (R) of 0.036 and weighted average of 66.5%. Similarly, the statistical analysis conducted on geographies consisting of 99,332,457 people shows a substantial negative correlation between the proportion of Somalis and percentage of population with at least college, under 1 year education in the United States with a correlation coefficient (R) of -0.593 and weighted average of 65.8%, a difference of 1.1%.
College, Under 1 year Correlation Summary
| Measurement | Immigrants from Morocco | Somali |
| Minimum | 36.5% | 29.5% |
| Maximum | 89.7% | 85.2% |
| Range | 53.2% | 55.6% |
| Mean | 64.5% | 62.4% |
| Median | 66.5% | 63.8% |
| Interquartile 25% (IQ1) | 58.0% | 56.1% |
| Interquartile 75% (IQ3) | 71.2% | 68.3% |
| Interquartile Range (IQR) | 13.2% | 12.2% |
| Standard Deviation (Sample) | 10.1% | 10.9% |
| Standard Deviation (Population) | 9.9% | 10.8% |
Demographics Similar to Immigrants from Morocco and Somalis by College, Under 1 year
In terms of college, under 1 year, the demographic groups most similar to Immigrants from Morocco are Kenyan (66.5%, a difference of 0.0%), Immigrants from Kenya (66.5%, a difference of 0.010%), Taiwanese (66.4%, a difference of 0.21%), Immigrants from Venezuela (66.3%, a difference of 0.25%), and Immigrants from Iraq (66.3%, a difference of 0.30%). Similarly, the demographic groups most similar to Somalis are Czechoslovakian (65.8%, a difference of 0.010%), Immigrants from Uzbekistan (65.8%, a difference of 0.050%), Korean (65.9%, a difference of 0.12%), Albanian (65.9%, a difference of 0.16%), and Brazilian (65.9%, a difference of 0.16%).
| Demographics | Rating | Rank | College, Under 1 year |
| Immigrants | Kenya | 81.8 /100 | #145 | Excellent 66.5% |
| Kenyans | 81.7 /100 | #146 | Excellent 66.5% |
| Immigrants | Morocco | 81.7 /100 | #147 | Excellent 66.5% |
| Taiwanese | 78.6 /100 | #148 | Good 66.4% |
| Immigrants | Venezuela | 77.9 /100 | #149 | Good 66.3% |
| Immigrants | Iraq | 77.1 /100 | #150 | Good 66.3% |
| Immigrants | Sudan | 76.0 /100 | #151 | Good 66.2% |
| Sudanese | 74.1 /100 | #152 | Good 66.2% |
| Belgians | 73.7 /100 | #153 | Good 66.2% |
| Immigrants | Eritrea | 71.9 /100 | #154 | Good 66.1% |
| Irish | 70.3 /100 | #155 | Good 66.0% |
| Welsh | 69.9 /100 | #156 | Good 66.0% |
| Sierra Leoneans | 67.8 /100 | #157 | Good 66.0% |
| Celtics | 67.3 /100 | #158 | Good 65.9% |
| Tlingit-Haida | 66.4 /100 | #159 | Good 65.9% |
| Albanians | 66.1 /100 | #160 | Good 65.9% |
| Brazilians | 66.0 /100 | #161 | Good 65.9% |
| Koreans | 65.3 /100 | #162 | Good 65.9% |
| Somalis | 62.7 /100 | #163 | Good 65.8% |
| Czechoslovakians | 62.6 /100 | #164 | Good 65.8% |
| Immigrants | Uzbekistan | 61.6 /100 | #165 | Good 65.8% |