Immigrants from Armenia vs Immigrants from Guatemala College, Under 1 year
COMPARE
Immigrants from Armenia
Immigrants from Guatemala
College, Under 1 year
College, Under 1 year Comparison
Immigrants from Armenia
Immigrants from Guatemala
64.7%
COLLEGE, UNDER 1 YEAR
28.1/ 100
METRIC RATING
191st/ 347
METRIC RANK
56.2%
COLLEGE, UNDER 1 YEAR
0.0/ 100
METRIC RATING
327th/ 347
METRIC RANK
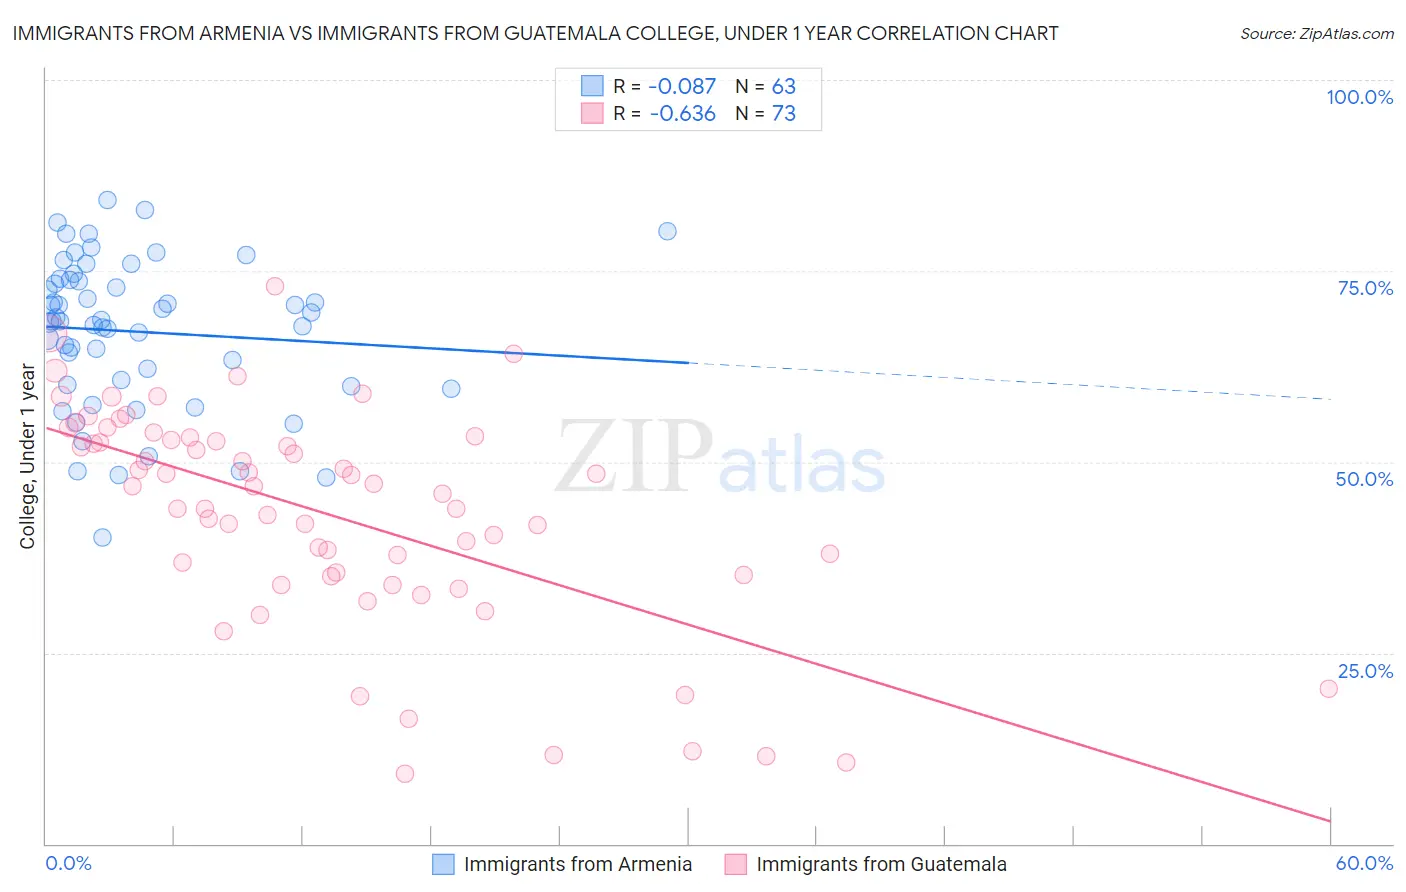
Immigrants from Armenia vs Immigrants from Guatemala College, Under 1 year Correlation Chart
The statistical analysis conducted on geographies consisting of 97,725,183 people shows a slight negative correlation between the proportion of Immigrants from Armenia and percentage of population with at least college, under 1 year education in the United States with a correlation coefficient (R) of -0.087 and weighted average of 64.7%. Similarly, the statistical analysis conducted on geographies consisting of 377,285,561 people shows a significant negative correlation between the proportion of Immigrants from Guatemala and percentage of population with at least college, under 1 year education in the United States with a correlation coefficient (R) of -0.636 and weighted average of 56.2%, a difference of 15.2%.
College, Under 1 year Correlation Summary
| Measurement | Immigrants from Armenia | Immigrants from Guatemala |
| Minimum | 40.2% | 9.2% |
| Maximum | 84.3% | 73.0% |
| Range | 44.1% | 63.8% |
| Mean | 67.0% | 43.2% |
| Median | 68.4% | 46.8% |
| Interquartile 25% (IQ1) | 60.1% | 35.1% |
| Interquartile 75% (IQ3) | 73.8% | 53.1% |
| Interquartile Range (IQR) | 13.6% | 18.0% |
| Standard Deviation (Sample) | 9.7% | 14.3% |
| Standard Deviation (Population) | 9.7% | 14.2% |
Similar Demographics by College, Under 1 year
Demographics Similar to Immigrants from Armenia by College, Under 1 year
In terms of college, under 1 year, the demographic groups most similar to Immigrants from Armenia are Immigrants from Thailand (64.7%, a difference of 0.060%), Slovak (64.7%, a difference of 0.070%), Immigrants from Philippines (64.8%, a difference of 0.11%), Spanish (64.9%, a difference of 0.19%), and Immigrants from Cameroon (64.6%, a difference of 0.20%).
| Demographics | Rating | Rank | College, Under 1 year |
| Bermudans | 42.0 /100 | #184 | Average 65.2% |
| Sri Lankans | 41.7 /100 | #185 | Average 65.2% |
| Immigrants | Sierra Leone | 39.7 /100 | #186 | Fair 65.1% |
| Immigrants | Southern Europe | 34.3 /100 | #187 | Fair 64.9% |
| Immigrants | Albania | 32.0 /100 | #188 | Fair 64.9% |
| Spanish | 31.6 /100 | #189 | Fair 64.9% |
| Immigrants | Philippines | 30.1 /100 | #190 | Fair 64.8% |
| Immigrants | Armenia | 28.1 /100 | #191 | Fair 64.7% |
| Immigrants | Thailand | 27.0 /100 | #192 | Fair 64.7% |
| Slovaks | 26.7 /100 | #193 | Fair 64.7% |
| Immigrants | Cameroon | 24.6 /100 | #194 | Fair 64.6% |
| Immigrants | South Eastern Asia | 22.1 /100 | #195 | Fair 64.5% |
| Tongans | 21.2 /100 | #196 | Fair 64.5% |
| Costa Ricans | 19.6 /100 | #197 | Poor 64.4% |
| Tsimshian | 17.9 /100 | #198 | Poor 64.3% |
Demographics Similar to Immigrants from Guatemala by College, Under 1 year
In terms of college, under 1 year, the demographic groups most similar to Immigrants from Guatemala are Navajo (56.3%, a difference of 0.090%), Immigrants from Latin America (56.3%, a difference of 0.24%), Cape Verdean (56.0%, a difference of 0.29%), Immigrants from El Salvador (56.4%, a difference of 0.34%), and Immigrants from Honduras (56.5%, a difference of 0.47%).
| Demographics | Rating | Rank | College, Under 1 year |
| Guatemalans | 0.0 /100 | #320 | Tragic 56.8% |
| Natives/Alaskans | 0.0 /100 | #321 | Tragic 56.6% |
| Immigrants | Caribbean | 0.0 /100 | #322 | Tragic 56.6% |
| Immigrants | Honduras | 0.0 /100 | #323 | Tragic 56.5% |
| Immigrants | El Salvador | 0.0 /100 | #324 | Tragic 56.4% |
| Immigrants | Latin America | 0.0 /100 | #325 | Tragic 56.3% |
| Navajo | 0.0 /100 | #326 | Tragic 56.3% |
| Immigrants | Guatemala | 0.0 /100 | #327 | Tragic 56.2% |
| Cape Verdeans | 0.0 /100 | #328 | Tragic 56.0% |
| Immigrants | Cuba | 0.0 /100 | #329 | Tragic 55.7% |
| Mexicans | 0.0 /100 | #330 | Tragic 55.6% |
| Dominicans | 0.0 /100 | #331 | Tragic 55.5% |
| Immigrants | Yemen | 0.0 /100 | #332 | Tragic 55.3% |
| Yuman | 0.0 /100 | #333 | Tragic 55.1% |
| Immigrants | Azores | 0.0 /100 | #334 | Tragic 54.7% |