Immigrants from Kuwait vs Immigrants from Guatemala College, Under 1 year
COMPARE
Immigrants from Kuwait
Immigrants from Guatemala
College, Under 1 year
College, Under 1 year Comparison
Immigrants from Kuwait
Immigrants from Guatemala
70.3%
COLLEGE, UNDER 1 YEAR
99.9/ 100
METRIC RATING
41st/ 347
METRIC RANK
56.2%
COLLEGE, UNDER 1 YEAR
0.0/ 100
METRIC RATING
327th/ 347
METRIC RANK
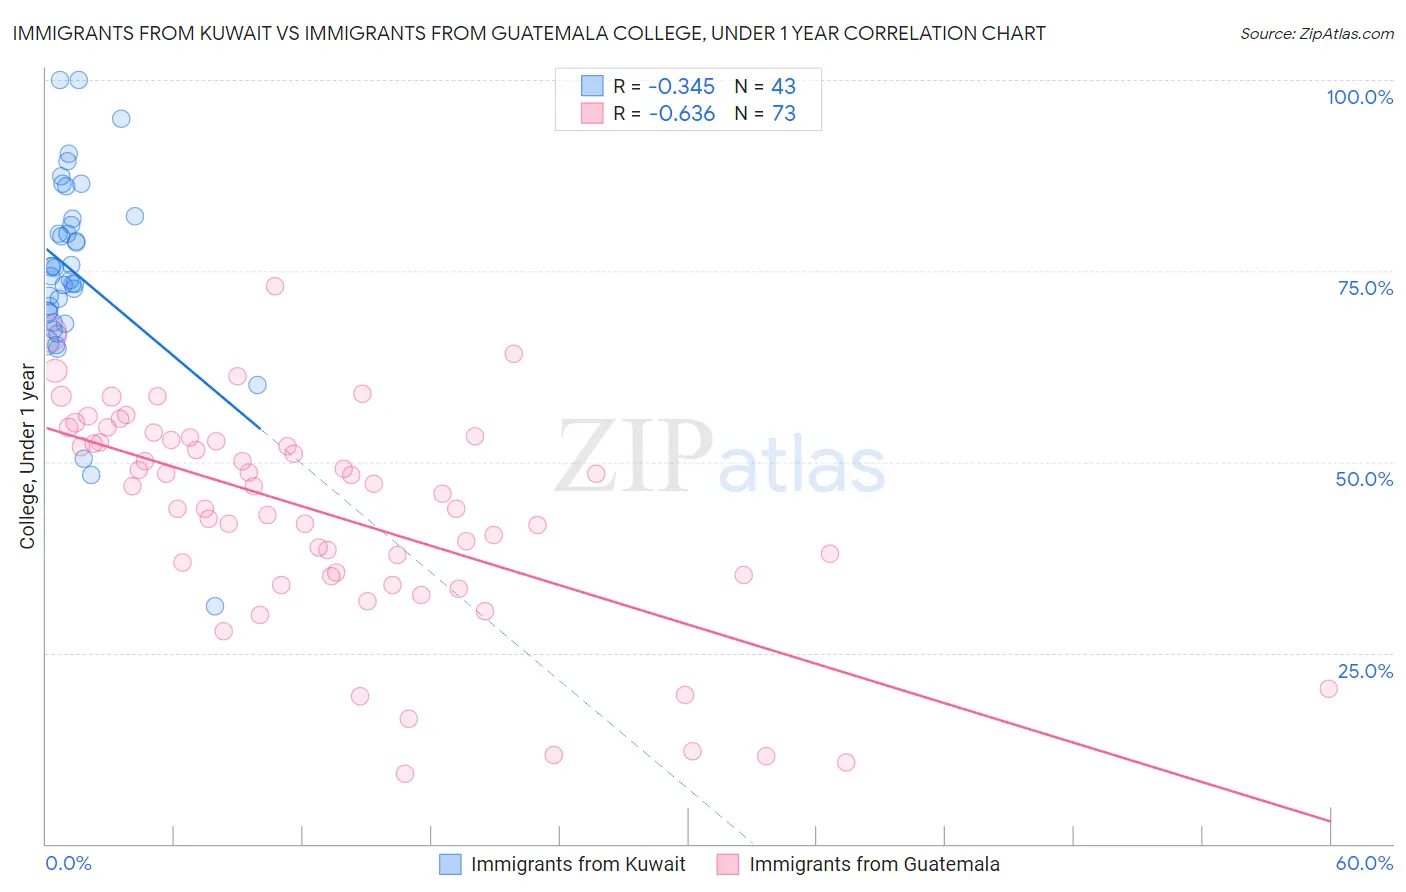
Immigrants from Kuwait vs Immigrants from Guatemala College, Under 1 year Correlation Chart
The statistical analysis conducted on geographies consisting of 136,917,085 people shows a mild negative correlation between the proportion of Immigrants from Kuwait and percentage of population with at least college, under 1 year education in the United States with a correlation coefficient (R) of -0.345 and weighted average of 70.3%. Similarly, the statistical analysis conducted on geographies consisting of 377,285,561 people shows a significant negative correlation between the proportion of Immigrants from Guatemala and percentage of population with at least college, under 1 year education in the United States with a correlation coefficient (R) of -0.636 and weighted average of 56.2%, a difference of 25.1%.
College, Under 1 year Correlation Summary
| Measurement | Immigrants from Kuwait | Immigrants from Guatemala |
| Minimum | 31.0% | 9.2% |
| Maximum | 100.0% | 73.0% |
| Range | 69.0% | 63.8% |
| Mean | 74.8% | 43.2% |
| Median | 74.3% | 46.8% |
| Interquartile 25% (IQ1) | 68.3% | 35.1% |
| Interquartile 75% (IQ3) | 81.8% | 53.1% |
| Interquartile Range (IQR) | 13.5% | 18.0% |
| Standard Deviation (Sample) | 12.9% | 14.3% |
| Standard Deviation (Population) | 12.7% | 14.2% |
Similar Demographics by College, Under 1 year
Demographics Similar to Immigrants from Kuwait by College, Under 1 year
In terms of college, under 1 year, the demographic groups most similar to Immigrants from Kuwait are Immigrants from Turkey (70.3%, a difference of 0.040%), Bhutanese (70.3%, a difference of 0.050%), Immigrants from Lithuania (70.3%, a difference of 0.050%), Australian (70.4%, a difference of 0.070%), and Israeli (70.2%, a difference of 0.11%).
| Demographics | Rating | Rank | College, Under 1 year |
| Estonians | 99.9 /100 | #34 | Exceptional 70.6% |
| Russians | 99.9 /100 | #35 | Exceptional 70.5% |
| Immigrants | Sri Lanka | 99.9 /100 | #36 | Exceptional 70.5% |
| Immigrants | Saudi Arabia | 99.9 /100 | #37 | Exceptional 70.4% |
| Australians | 99.9 /100 | #38 | Exceptional 70.4% |
| Bhutanese | 99.9 /100 | #39 | Exceptional 70.3% |
| Immigrants | Turkey | 99.9 /100 | #40 | Exceptional 70.3% |
| Immigrants | Kuwait | 99.9 /100 | #41 | Exceptional 70.3% |
| Immigrants | Lithuania | 99.9 /100 | #42 | Exceptional 70.3% |
| Israelis | 99.9 /100 | #43 | Exceptional 70.2% |
| New Zealanders | 99.9 /100 | #44 | Exceptional 70.2% |
| Immigrants | Norway | 99.9 /100 | #45 | Exceptional 70.2% |
| Immigrants | Latvia | 99.9 /100 | #46 | Exceptional 70.1% |
| Immigrants | Bulgaria | 99.8 /100 | #47 | Exceptional 70.0% |
| Immigrants | Netherlands | 99.8 /100 | #48 | Exceptional 70.0% |
Demographics Similar to Immigrants from Guatemala by College, Under 1 year
In terms of college, under 1 year, the demographic groups most similar to Immigrants from Guatemala are Navajo (56.3%, a difference of 0.090%), Immigrants from Latin America (56.3%, a difference of 0.24%), Cape Verdean (56.0%, a difference of 0.29%), Immigrants from El Salvador (56.4%, a difference of 0.34%), and Immigrants from Honduras (56.5%, a difference of 0.47%).
| Demographics | Rating | Rank | College, Under 1 year |
| Guatemalans | 0.0 /100 | #320 | Tragic 56.8% |
| Natives/Alaskans | 0.0 /100 | #321 | Tragic 56.6% |
| Immigrants | Caribbean | 0.0 /100 | #322 | Tragic 56.6% |
| Immigrants | Honduras | 0.0 /100 | #323 | Tragic 56.5% |
| Immigrants | El Salvador | 0.0 /100 | #324 | Tragic 56.4% |
| Immigrants | Latin America | 0.0 /100 | #325 | Tragic 56.3% |
| Navajo | 0.0 /100 | #326 | Tragic 56.3% |
| Immigrants | Guatemala | 0.0 /100 | #327 | Tragic 56.2% |
| Cape Verdeans | 0.0 /100 | #328 | Tragic 56.0% |
| Immigrants | Cuba | 0.0 /100 | #329 | Tragic 55.7% |
| Mexicans | 0.0 /100 | #330 | Tragic 55.6% |
| Dominicans | 0.0 /100 | #331 | Tragic 55.5% |
| Immigrants | Yemen | 0.0 /100 | #332 | Tragic 55.3% |
| Yuman | 0.0 /100 | #333 | Tragic 55.1% |
| Immigrants | Azores | 0.0 /100 | #334 | Tragic 54.7% |