Immigrants from Eritrea vs Immigrants from Guatemala College, Under 1 year
COMPARE
Immigrants from Eritrea
Immigrants from Guatemala
College, Under 1 year
College, Under 1 year Comparison
Immigrants from Eritrea
Immigrants from Guatemala
66.1%
COLLEGE, UNDER 1 YEAR
71.9/ 100
METRIC RATING
154th/ 347
METRIC RANK
56.2%
COLLEGE, UNDER 1 YEAR
0.0/ 100
METRIC RATING
327th/ 347
METRIC RANK
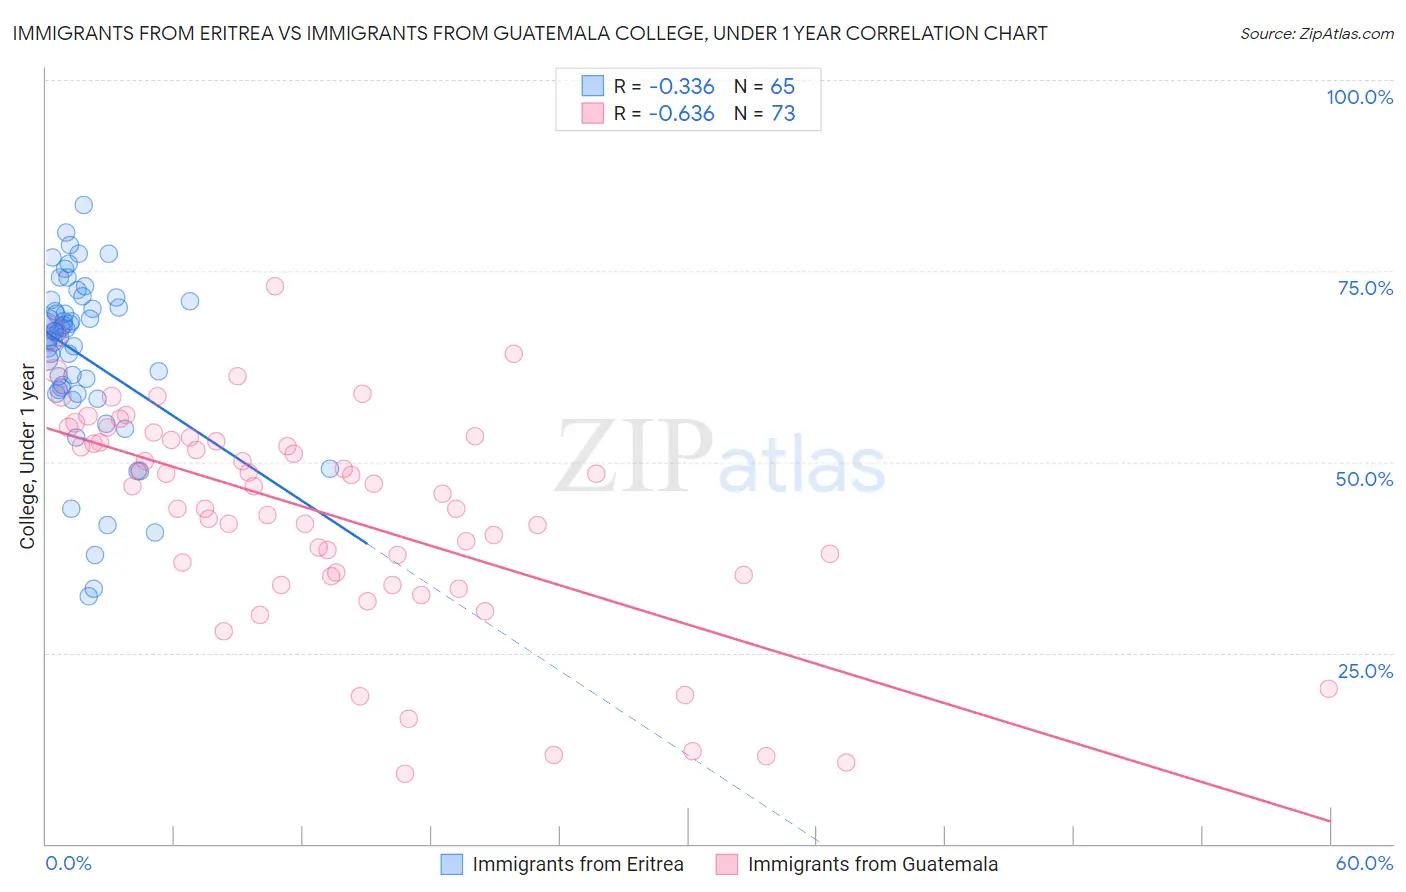
Immigrants from Eritrea vs Immigrants from Guatemala College, Under 1 year Correlation Chart
The statistical analysis conducted on geographies consisting of 104,852,201 people shows a mild negative correlation between the proportion of Immigrants from Eritrea and percentage of population with at least college, under 1 year education in the United States with a correlation coefficient (R) of -0.336 and weighted average of 66.1%. Similarly, the statistical analysis conducted on geographies consisting of 377,285,561 people shows a significant negative correlation between the proportion of Immigrants from Guatemala and percentage of population with at least college, under 1 year education in the United States with a correlation coefficient (R) of -0.636 and weighted average of 56.2%, a difference of 17.6%.
College, Under 1 year Correlation Summary
| Measurement | Immigrants from Eritrea | Immigrants from Guatemala |
| Minimum | 32.4% | 9.2% |
| Maximum | 83.6% | 73.0% |
| Range | 51.2% | 63.8% |
| Mean | 63.9% | 43.2% |
| Median | 66.9% | 46.8% |
| Interquartile 25% (IQ1) | 59.2% | 35.1% |
| Interquartile 75% (IQ3) | 70.6% | 53.1% |
| Interquartile Range (IQR) | 11.4% | 18.0% |
| Standard Deviation (Sample) | 11.1% | 14.3% |
| Standard Deviation (Population) | 11.0% | 14.2% |
Similar Demographics by College, Under 1 year
Demographics Similar to Immigrants from Eritrea by College, Under 1 year
In terms of college, under 1 year, the demographic groups most similar to Immigrants from Eritrea are Irish (66.0%, a difference of 0.090%), Belgian (66.2%, a difference of 0.10%), Welsh (66.0%, a difference of 0.11%), Sudanese (66.2%, a difference of 0.12%), and Sierra Leonean (66.0%, a difference of 0.21%).
| Demographics | Rating | Rank | College, Under 1 year |
| Immigrants | Morocco | 81.7 /100 | #147 | Excellent 66.5% |
| Taiwanese | 78.6 /100 | #148 | Good 66.4% |
| Immigrants | Venezuela | 77.9 /100 | #149 | Good 66.3% |
| Immigrants | Iraq | 77.1 /100 | #150 | Good 66.3% |
| Immigrants | Sudan | 76.0 /100 | #151 | Good 66.2% |
| Sudanese | 74.1 /100 | #152 | Good 66.2% |
| Belgians | 73.7 /100 | #153 | Good 66.2% |
| Immigrants | Eritrea | 71.9 /100 | #154 | Good 66.1% |
| Irish | 70.3 /100 | #155 | Good 66.0% |
| Welsh | 69.9 /100 | #156 | Good 66.0% |
| Sierra Leoneans | 67.8 /100 | #157 | Good 66.0% |
| Celtics | 67.3 /100 | #158 | Good 65.9% |
| Tlingit-Haida | 66.4 /100 | #159 | Good 65.9% |
| Albanians | 66.1 /100 | #160 | Good 65.9% |
| Brazilians | 66.0 /100 | #161 | Good 65.9% |
Demographics Similar to Immigrants from Guatemala by College, Under 1 year
In terms of college, under 1 year, the demographic groups most similar to Immigrants from Guatemala are Navajo (56.3%, a difference of 0.090%), Immigrants from Latin America (56.3%, a difference of 0.24%), Cape Verdean (56.0%, a difference of 0.29%), Immigrants from El Salvador (56.4%, a difference of 0.34%), and Immigrants from Honduras (56.5%, a difference of 0.47%).
| Demographics | Rating | Rank | College, Under 1 year |
| Guatemalans | 0.0 /100 | #320 | Tragic 56.8% |
| Natives/Alaskans | 0.0 /100 | #321 | Tragic 56.6% |
| Immigrants | Caribbean | 0.0 /100 | #322 | Tragic 56.6% |
| Immigrants | Honduras | 0.0 /100 | #323 | Tragic 56.5% |
| Immigrants | El Salvador | 0.0 /100 | #324 | Tragic 56.4% |
| Immigrants | Latin America | 0.0 /100 | #325 | Tragic 56.3% |
| Navajo | 0.0 /100 | #326 | Tragic 56.3% |
| Immigrants | Guatemala | 0.0 /100 | #327 | Tragic 56.2% |
| Cape Verdeans | 0.0 /100 | #328 | Tragic 56.0% |
| Immigrants | Cuba | 0.0 /100 | #329 | Tragic 55.7% |
| Mexicans | 0.0 /100 | #330 | Tragic 55.6% |
| Dominicans | 0.0 /100 | #331 | Tragic 55.5% |
| Immigrants | Yemen | 0.0 /100 | #332 | Tragic 55.3% |
| Yuman | 0.0 /100 | #333 | Tragic 55.1% |
| Immigrants | Azores | 0.0 /100 | #334 | Tragic 54.7% |