Immigrants from Morocco vs Welsh College, Under 1 year
COMPARE
Immigrants from Morocco
Welsh
College, Under 1 year
College, Under 1 year Comparison
Immigrants from Morocco
Welsh
66.5%
COLLEGE, UNDER 1 YEAR
81.7/ 100
METRIC RATING
147th/ 347
METRIC RANK
66.0%
COLLEGE, UNDER 1 YEAR
69.9/ 100
METRIC RATING
156th/ 347
METRIC RANK
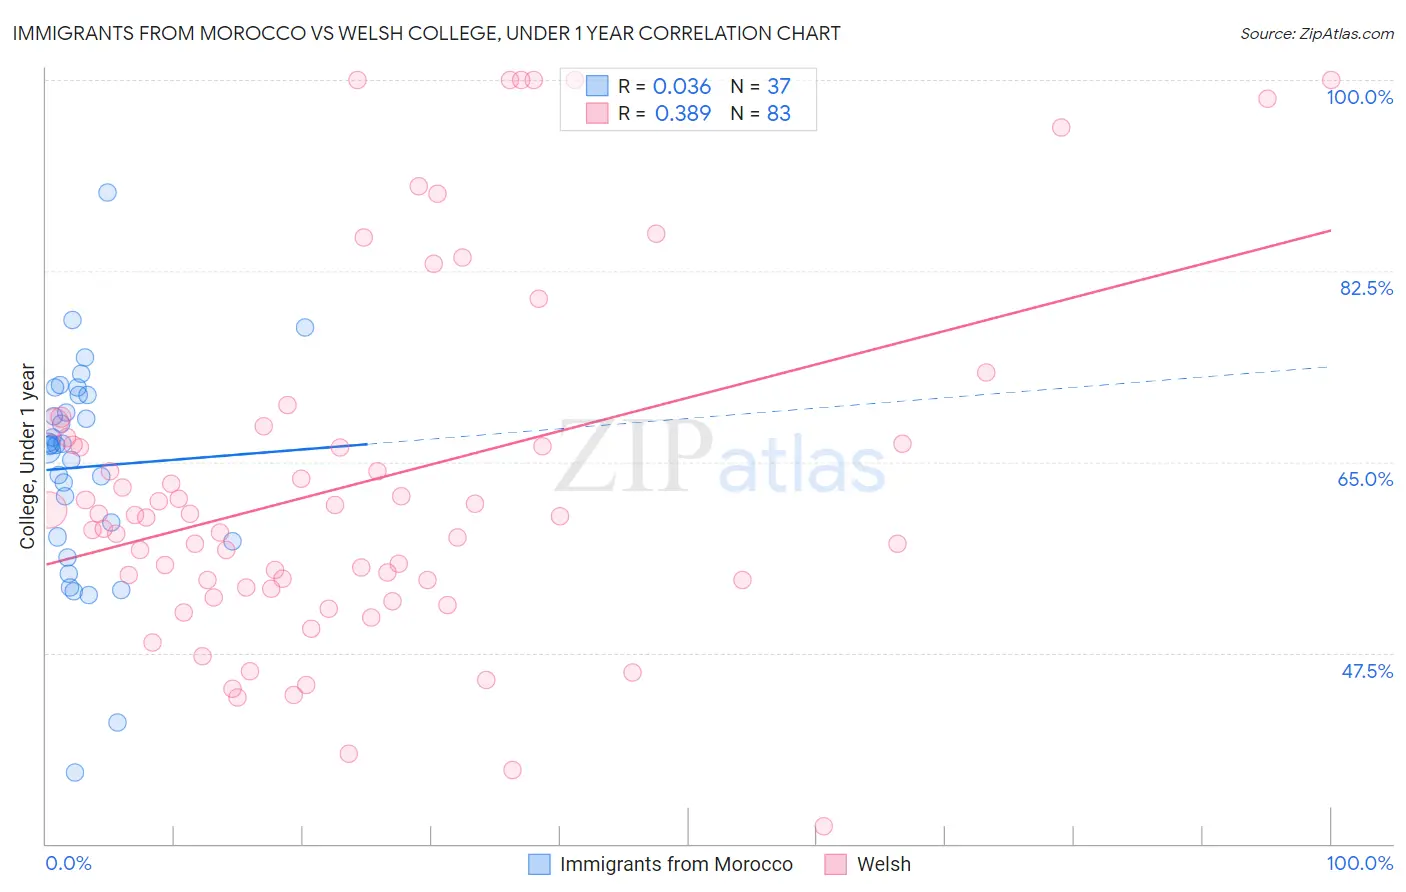
Immigrants from Morocco vs Welsh College, Under 1 year Correlation Chart
The statistical analysis conducted on geographies consisting of 178,912,438 people shows no correlation between the proportion of Immigrants from Morocco and percentage of population with at least college, under 1 year education in the United States with a correlation coefficient (R) of 0.036 and weighted average of 66.5%. Similarly, the statistical analysis conducted on geographies consisting of 528,593,935 people shows a mild positive correlation between the proportion of Welsh and percentage of population with at least college, under 1 year education in the United States with a correlation coefficient (R) of 0.389 and weighted average of 66.0%, a difference of 0.71%.
College, Under 1 year Correlation Summary
| Measurement | Immigrants from Morocco | Welsh |
| Minimum | 36.5% | 31.6% |
| Maximum | 89.7% | 100.0% |
| Range | 53.2% | 68.4% |
| Mean | 64.5% | 63.1% |
| Median | 66.5% | 60.0% |
| Interquartile 25% (IQ1) | 58.0% | 53.5% |
| Interquartile 75% (IQ3) | 71.2% | 67.2% |
| Interquartile Range (IQR) | 13.2% | 13.7% |
| Standard Deviation (Sample) | 10.1% | 16.3% |
| Standard Deviation (Population) | 9.9% | 16.2% |
Demographics Similar to Immigrants from Morocco and Welsh by College, Under 1 year
In terms of college, under 1 year, the demographic groups most similar to Immigrants from Morocco are Kenyan (66.5%, a difference of 0.0%), Immigrants from Kenya (66.5%, a difference of 0.010%), Immigrants from Germany (66.5%, a difference of 0.020%), Immigrants from Uganda (66.5%, a difference of 0.080%), and English (66.6%, a difference of 0.090%). Similarly, the demographic groups most similar to Welsh are Irish (66.0%, a difference of 0.020%), Sierra Leonean (66.0%, a difference of 0.10%), Immigrants from Eritrea (66.1%, a difference of 0.11%), Celtic (65.9%, a difference of 0.13%), and Tlingit-Haida (65.9%, a difference of 0.18%).
| Demographics | Rating | Rank | College, Under 1 year |
| Immigrants | Afghanistan | 85.1 /100 | #141 | Excellent 66.7% |
| English | 82.9 /100 | #142 | Excellent 66.6% |
| Immigrants | Uganda | 82.8 /100 | #143 | Excellent 66.5% |
| Immigrants | Germany | 82.0 /100 | #144 | Excellent 66.5% |
| Immigrants | Kenya | 81.8 /100 | #145 | Excellent 66.5% |
| Kenyans | 81.7 /100 | #146 | Excellent 66.5% |
| Immigrants | Morocco | 81.7 /100 | #147 | Excellent 66.5% |
| Taiwanese | 78.6 /100 | #148 | Good 66.4% |
| Immigrants | Venezuela | 77.9 /100 | #149 | Good 66.3% |
| Immigrants | Iraq | 77.1 /100 | #150 | Good 66.3% |
| Immigrants | Sudan | 76.0 /100 | #151 | Good 66.2% |
| Sudanese | 74.1 /100 | #152 | Good 66.2% |
| Belgians | 73.7 /100 | #153 | Good 66.2% |
| Immigrants | Eritrea | 71.9 /100 | #154 | Good 66.1% |
| Irish | 70.3 /100 | #155 | Good 66.0% |
| Welsh | 69.9 /100 | #156 | Good 66.0% |
| Sierra Leoneans | 67.8 /100 | #157 | Good 66.0% |
| Celtics | 67.3 /100 | #158 | Good 65.9% |
| Tlingit-Haida | 66.4 /100 | #159 | Good 65.9% |
| Albanians | 66.1 /100 | #160 | Good 65.9% |
| Brazilians | 66.0 /100 | #161 | Good 65.9% |