Immigrants from Morocco vs Belizean College, Under 1 year
COMPARE
Immigrants from Morocco
Belizean
College, Under 1 year
College, Under 1 year Comparison
Immigrants from Morocco
Belizeans
66.5%
COLLEGE, UNDER 1 YEAR
81.7/ 100
METRIC RATING
147th/ 347
METRIC RANK
60.1%
COLLEGE, UNDER 1 YEAR
0.1/ 100
METRIC RATING
282nd/ 347
METRIC RANK
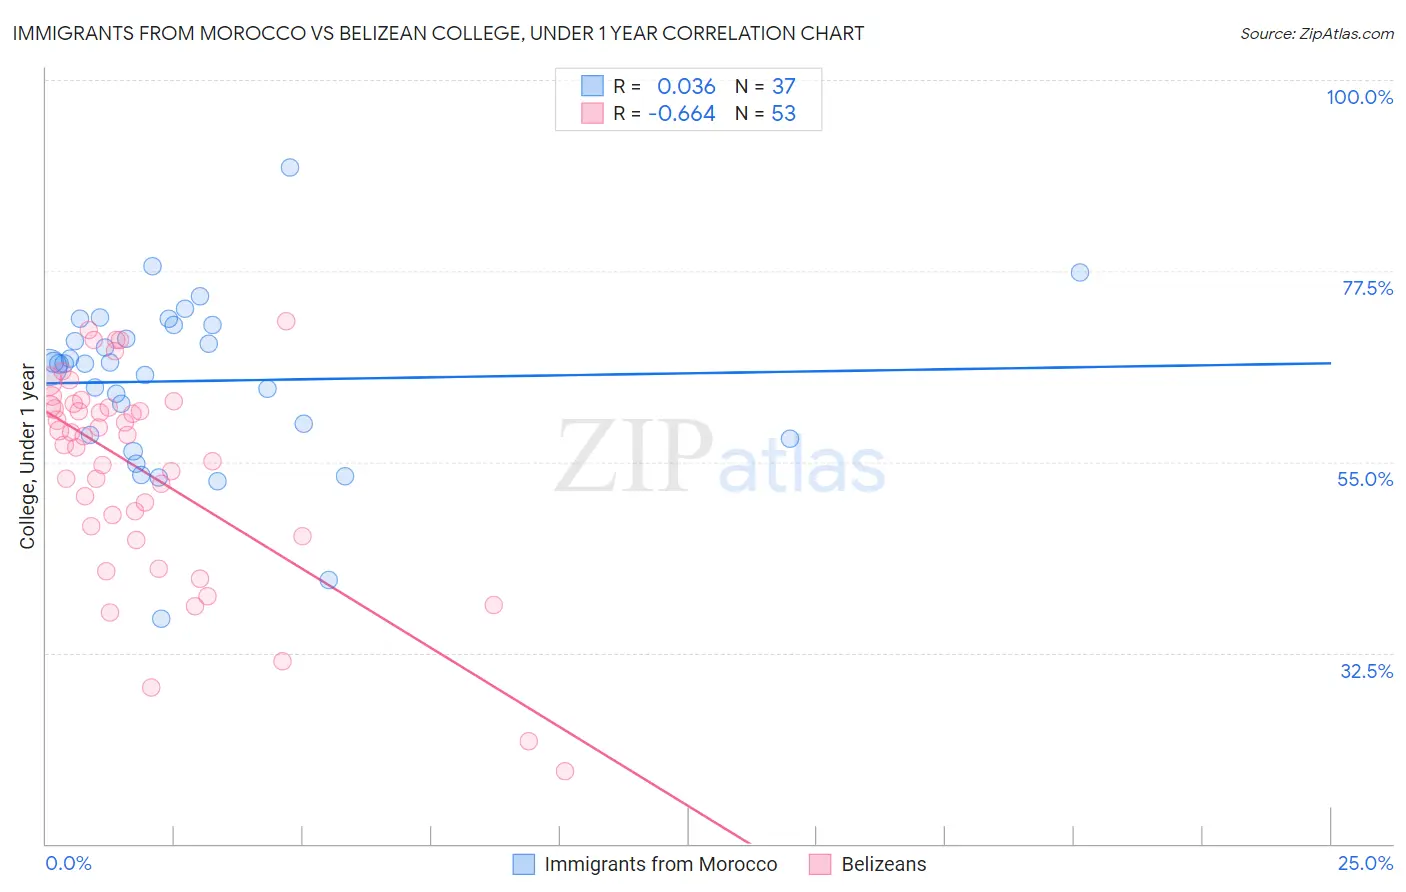
Immigrants from Morocco vs Belizean College, Under 1 year Correlation Chart
The statistical analysis conducted on geographies consisting of 178,912,438 people shows no correlation between the proportion of Immigrants from Morocco and percentage of population with at least college, under 1 year education in the United States with a correlation coefficient (R) of 0.036 and weighted average of 66.5%. Similarly, the statistical analysis conducted on geographies consisting of 144,224,111 people shows a significant negative correlation between the proportion of Belizeans and percentage of population with at least college, under 1 year education in the United States with a correlation coefficient (R) of -0.664 and weighted average of 60.1%, a difference of 10.7%.
College, Under 1 year Correlation Summary
| Measurement | Immigrants from Morocco | Belizean |
| Minimum | 36.5% | 18.5% |
| Maximum | 89.7% | 71.6% |
| Range | 53.2% | 53.1% |
| Mean | 64.5% | 53.9% |
| Median | 66.5% | 58.0% |
| Interquartile 25% (IQ1) | 58.0% | 46.8% |
| Interquartile 75% (IQ3) | 71.2% | 61.7% |
| Interquartile Range (IQR) | 13.2% | 14.9% |
| Standard Deviation (Sample) | 10.1% | 12.2% |
| Standard Deviation (Population) | 9.9% | 12.1% |
Similar Demographics by College, Under 1 year
Demographics Similar to Immigrants from Morocco by College, Under 1 year
In terms of college, under 1 year, the demographic groups most similar to Immigrants from Morocco are Kenyan (66.5%, a difference of 0.0%), Immigrants from Kenya (66.5%, a difference of 0.010%), Immigrants from Germany (66.5%, a difference of 0.020%), Immigrants from Uganda (66.5%, a difference of 0.080%), and English (66.6%, a difference of 0.090%).
| Demographics | Rating | Rank | College, Under 1 year |
| Slavs | 85.9 /100 | #140 | Excellent 66.7% |
| Immigrants | Afghanistan | 85.1 /100 | #141 | Excellent 66.7% |
| English | 82.9 /100 | #142 | Excellent 66.6% |
| Immigrants | Uganda | 82.8 /100 | #143 | Excellent 66.5% |
| Immigrants | Germany | 82.0 /100 | #144 | Excellent 66.5% |
| Immigrants | Kenya | 81.8 /100 | #145 | Excellent 66.5% |
| Kenyans | 81.7 /100 | #146 | Excellent 66.5% |
| Immigrants | Morocco | 81.7 /100 | #147 | Excellent 66.5% |
| Taiwanese | 78.6 /100 | #148 | Good 66.4% |
| Immigrants | Venezuela | 77.9 /100 | #149 | Good 66.3% |
| Immigrants | Iraq | 77.1 /100 | #150 | Good 66.3% |
| Immigrants | Sudan | 76.0 /100 | #151 | Good 66.2% |
| Sudanese | 74.1 /100 | #152 | Good 66.2% |
| Belgians | 73.7 /100 | #153 | Good 66.2% |
| Immigrants | Eritrea | 71.9 /100 | #154 | Good 66.1% |
Demographics Similar to Belizeans by College, Under 1 year
In terms of college, under 1 year, the demographic groups most similar to Belizeans are Cherokee (60.1%, a difference of 0.040%), Crow (60.2%, a difference of 0.16%), Ute (60.2%, a difference of 0.25%), Yaqui (60.2%, a difference of 0.26%), and Bahamian (60.3%, a difference of 0.29%).
| Demographics | Rating | Rank | College, Under 1 year |
| Immigrants | Barbados | 0.1 /100 | #275 | Tragic 60.4% |
| Arapaho | 0.1 /100 | #276 | Tragic 60.3% |
| Bahamians | 0.1 /100 | #277 | Tragic 60.3% |
| Yaqui | 0.1 /100 | #278 | Tragic 60.2% |
| Ute | 0.1 /100 | #279 | Tragic 60.2% |
| Crow | 0.1 /100 | #280 | Tragic 60.2% |
| Cherokee | 0.1 /100 | #281 | Tragic 60.1% |
| Belizeans | 0.1 /100 | #282 | Tragic 60.1% |
| Immigrants | Jamaica | 0.0 /100 | #283 | Tragic 59.7% |
| Immigrants | St. Vincent and the Grenadines | 0.0 /100 | #284 | Tragic 59.6% |
| Paiute | 0.0 /100 | #285 | Tragic 59.6% |
| British West Indians | 0.0 /100 | #286 | Tragic 59.5% |
| Sioux | 0.0 /100 | #287 | Tragic 59.4% |
| Blacks/African Americans | 0.0 /100 | #288 | Tragic 59.4% |
| Choctaw | 0.0 /100 | #289 | Tragic 59.3% |