Immigrants from Morocco vs Scottish College, Under 1 year
COMPARE
Immigrants from Morocco
Scottish
College, Under 1 year
College, Under 1 year Comparison
Immigrants from Morocco
Scottish
66.5%
COLLEGE, UNDER 1 YEAR
81.7/ 100
METRIC RATING
147th/ 347
METRIC RANK
67.0%
COLLEGE, UNDER 1 YEAR
90.2/ 100
METRIC RATING
128th/ 347
METRIC RANK
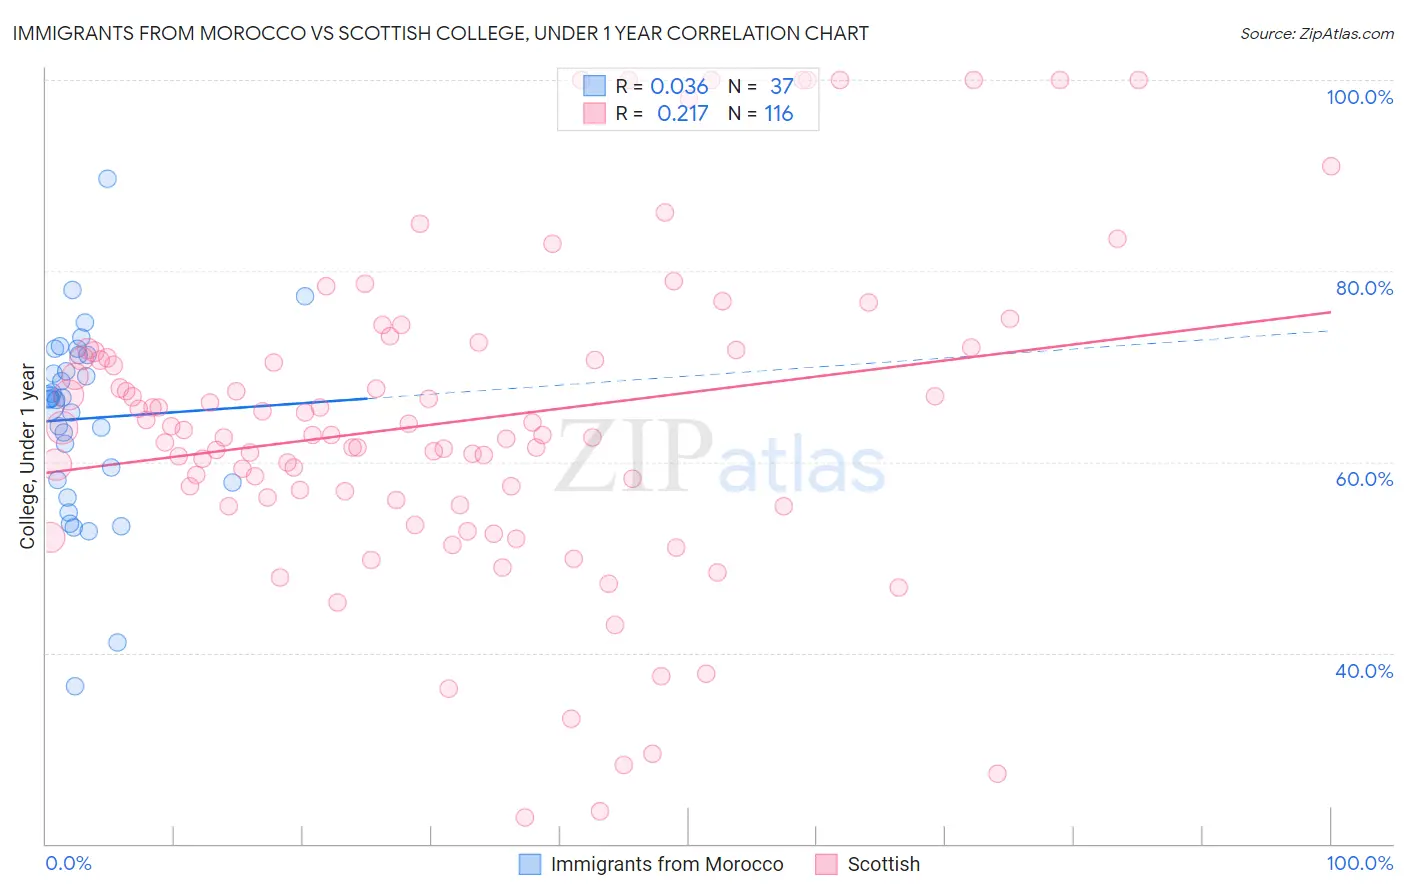
Immigrants from Morocco vs Scottish College, Under 1 year Correlation Chart
The statistical analysis conducted on geographies consisting of 178,912,438 people shows no correlation between the proportion of Immigrants from Morocco and percentage of population with at least college, under 1 year education in the United States with a correlation coefficient (R) of 0.036 and weighted average of 66.5%. Similarly, the statistical analysis conducted on geographies consisting of 567,137,181 people shows a weak positive correlation between the proportion of Scottish and percentage of population with at least college, under 1 year education in the United States with a correlation coefficient (R) of 0.217 and weighted average of 67.0%, a difference of 0.79%.
College, Under 1 year Correlation Summary
| Measurement | Immigrants from Morocco | Scottish |
| Minimum | 36.5% | 22.8% |
| Maximum | 89.7% | 100.0% |
| Range | 53.2% | 77.2% |
| Mean | 64.5% | 64.2% |
| Median | 66.5% | 62.8% |
| Interquartile 25% (IQ1) | 58.0% | 56.1% |
| Interquartile 75% (IQ3) | 71.2% | 71.2% |
| Interquartile Range (IQR) | 13.2% | 15.1% |
| Standard Deviation (Sample) | 10.1% | 16.6% |
| Standard Deviation (Population) | 9.9% | 16.6% |
Demographics Similar to Immigrants from Morocco and Scottish by College, Under 1 year
In terms of college, under 1 year, the demographic groups most similar to Immigrants from Morocco are Kenyan (66.5%, a difference of 0.0%), Immigrants from Kenya (66.5%, a difference of 0.010%), Immigrants from Germany (66.5%, a difference of 0.020%), Immigrants from Uganda (66.5%, a difference of 0.080%), and English (66.6%, a difference of 0.090%). Similarly, the demographic groups most similar to Scottish are Czech (67.1%, a difference of 0.070%), Immigrants from Eastern Africa (67.0%, a difference of 0.080%), Immigrants from Syria (66.9%, a difference of 0.14%), Finnish (66.9%, a difference of 0.19%), and Polish (66.9%, a difference of 0.20%).
| Demographics | Rating | Rank | College, Under 1 year |
| Czechs | 90.8 /100 | #127 | Exceptional 67.1% |
| Scottish | 90.2 /100 | #128 | Exceptional 67.0% |
| Immigrants | Eastern Africa | 89.5 /100 | #129 | Excellent 67.0% |
| Immigrants | Syria | 89.0 /100 | #130 | Excellent 66.9% |
| Finns | 88.6 /100 | #131 | Excellent 66.9% |
| Poles | 88.4 /100 | #132 | Excellent 66.9% |
| Immigrants | Brazil | 88.3 /100 | #133 | Excellent 66.9% |
| Iraqis | 88.0 /100 | #134 | Excellent 66.8% |
| Canadians | 87.9 /100 | #135 | Excellent 66.8% |
| Ugandans | 87.8 /100 | #136 | Excellent 66.8% |
| Immigrants | Chile | 87.4 /100 | #137 | Excellent 66.8% |
| Immigrants | Italy | 86.9 /100 | #138 | Excellent 66.8% |
| Venezuelans | 85.9 /100 | #139 | Excellent 66.7% |
| Slavs | 85.9 /100 | #140 | Excellent 66.7% |
| Immigrants | Afghanistan | 85.1 /100 | #141 | Excellent 66.7% |
| English | 82.9 /100 | #142 | Excellent 66.6% |
| Immigrants | Uganda | 82.8 /100 | #143 | Excellent 66.5% |
| Immigrants | Germany | 82.0 /100 | #144 | Excellent 66.5% |
| Immigrants | Kenya | 81.8 /100 | #145 | Excellent 66.5% |
| Kenyans | 81.7 /100 | #146 | Excellent 66.5% |
| Immigrants | Morocco | 81.7 /100 | #147 | Excellent 66.5% |