Immigrants from Uzbekistan vs Immigrants from Guatemala College, Under 1 year
COMPARE
Immigrants from Uzbekistan
Immigrants from Guatemala
College, Under 1 year
College, Under 1 year Comparison
Immigrants from Uzbekistan
Immigrants from Guatemala
65.8%
COLLEGE, UNDER 1 YEAR
61.6/ 100
METRIC RATING
165th/ 347
METRIC RANK
56.2%
COLLEGE, UNDER 1 YEAR
0.0/ 100
METRIC RATING
327th/ 347
METRIC RANK
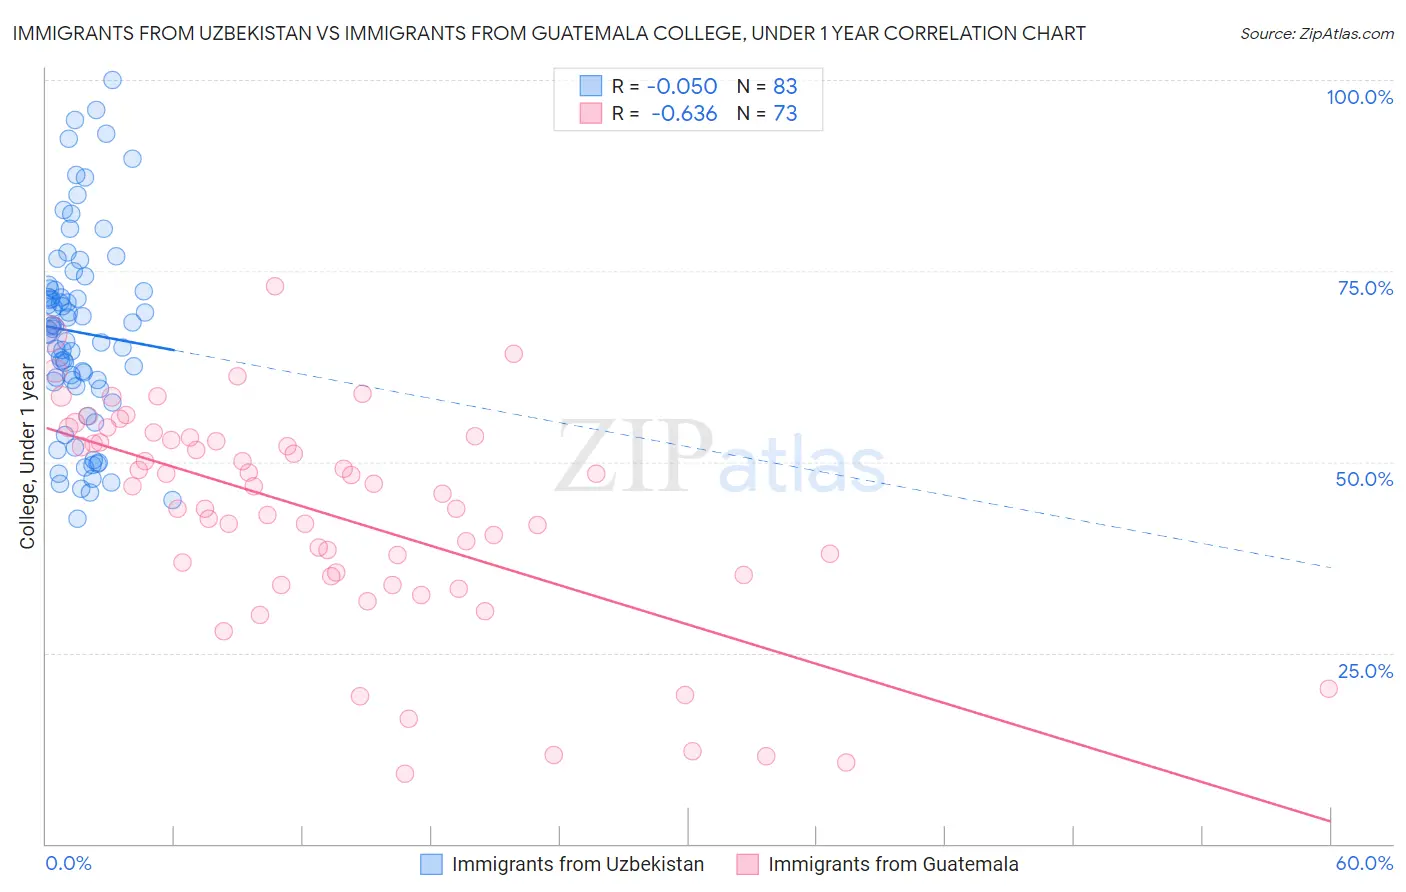
Immigrants from Uzbekistan vs Immigrants from Guatemala College, Under 1 year Correlation Chart
The statistical analysis conducted on geographies consisting of 118,765,305 people shows no correlation between the proportion of Immigrants from Uzbekistan and percentage of population with at least college, under 1 year education in the United States with a correlation coefficient (R) of -0.050 and weighted average of 65.8%. Similarly, the statistical analysis conducted on geographies consisting of 377,285,561 people shows a significant negative correlation between the proportion of Immigrants from Guatemala and percentage of population with at least college, under 1 year education in the United States with a correlation coefficient (R) of -0.636 and weighted average of 56.2%, a difference of 17.0%.
College, Under 1 year Correlation Summary
| Measurement | Immigrants from Uzbekistan | Immigrants from Guatemala |
| Minimum | 42.6% | 9.2% |
| Maximum | 100.0% | 73.0% |
| Range | 57.4% | 63.8% |
| Mean | 67.0% | 43.2% |
| Median | 67.4% | 46.8% |
| Interquartile 25% (IQ1) | 59.9% | 35.1% |
| Interquartile 75% (IQ3) | 72.6% | 53.1% |
| Interquartile Range (IQR) | 12.7% | 18.0% |
| Standard Deviation (Sample) | 12.9% | 14.3% |
| Standard Deviation (Population) | 12.9% | 14.2% |
Similar Demographics by College, Under 1 year
Demographics Similar to Immigrants from Uzbekistan by College, Under 1 year
In terms of college, under 1 year, the demographic groups most similar to Immigrants from Uzbekistan are Somali (65.8%, a difference of 0.050%), Czechoslovakian (65.8%, a difference of 0.050%), Korean (65.9%, a difference of 0.17%), Brazilian (65.9%, a difference of 0.21%), and Albanian (65.9%, a difference of 0.22%).
| Demographics | Rating | Rank | College, Under 1 year |
| Celtics | 67.3 /100 | #158 | Good 65.9% |
| Tlingit-Haida | 66.4 /100 | #159 | Good 65.9% |
| Albanians | 66.1 /100 | #160 | Good 65.9% |
| Brazilians | 66.0 /100 | #161 | Good 65.9% |
| Koreans | 65.3 /100 | #162 | Good 65.9% |
| Somalis | 62.7 /100 | #163 | Good 65.8% |
| Czechoslovakians | 62.6 /100 | #164 | Good 65.8% |
| Immigrants | Uzbekistan | 61.6 /100 | #165 | Good 65.8% |
| Moroccans | 56.7 /100 | #166 | Average 65.6% |
| Immigrants | Somalia | 56.4 /100 | #167 | Average 65.6% |
| Hungarians | 55.9 /100 | #168 | Average 65.6% |
| Yugoslavians | 55.7 /100 | #169 | Average 65.6% |
| Germans | 55.7 /100 | #170 | Average 65.6% |
| Immigrants | Oceania | 55.0 /100 | #171 | Average 65.6% |
| South American Indians | 54.4 /100 | #172 | Average 65.5% |
Demographics Similar to Immigrants from Guatemala by College, Under 1 year
In terms of college, under 1 year, the demographic groups most similar to Immigrants from Guatemala are Navajo (56.3%, a difference of 0.090%), Immigrants from Latin America (56.3%, a difference of 0.24%), Cape Verdean (56.0%, a difference of 0.29%), Immigrants from El Salvador (56.4%, a difference of 0.34%), and Immigrants from Honduras (56.5%, a difference of 0.47%).
| Demographics | Rating | Rank | College, Under 1 year |
| Guatemalans | 0.0 /100 | #320 | Tragic 56.8% |
| Natives/Alaskans | 0.0 /100 | #321 | Tragic 56.6% |
| Immigrants | Caribbean | 0.0 /100 | #322 | Tragic 56.6% |
| Immigrants | Honduras | 0.0 /100 | #323 | Tragic 56.5% |
| Immigrants | El Salvador | 0.0 /100 | #324 | Tragic 56.4% |
| Immigrants | Latin America | 0.0 /100 | #325 | Tragic 56.3% |
| Navajo | 0.0 /100 | #326 | Tragic 56.3% |
| Immigrants | Guatemala | 0.0 /100 | #327 | Tragic 56.2% |
| Cape Verdeans | 0.0 /100 | #328 | Tragic 56.0% |
| Immigrants | Cuba | 0.0 /100 | #329 | Tragic 55.7% |
| Mexicans | 0.0 /100 | #330 | Tragic 55.6% |
| Dominicans | 0.0 /100 | #331 | Tragic 55.5% |
| Immigrants | Yemen | 0.0 /100 | #332 | Tragic 55.3% |
| Yuman | 0.0 /100 | #333 | Tragic 55.1% |
| Immigrants | Azores | 0.0 /100 | #334 | Tragic 54.7% |