Immigrants from Morocco vs Immigrants from Guatemala In Labor Force | Age 30-34
COMPARE
Immigrants from Morocco
Immigrants from Guatemala
In Labor Force | Age 30-34
In Labor Force | Age 30-34 Comparison
Immigrants from Morocco
Immigrants from Guatemala
85.6%
IN LABOR FORCE | AGE 30-34
99.8/ 100
METRIC RATING
46th/ 347
METRIC RANK
83.7%
IN LABOR FORCE | AGE 30-34
0.1/ 100
METRIC RATING
266th/ 347
METRIC RANK
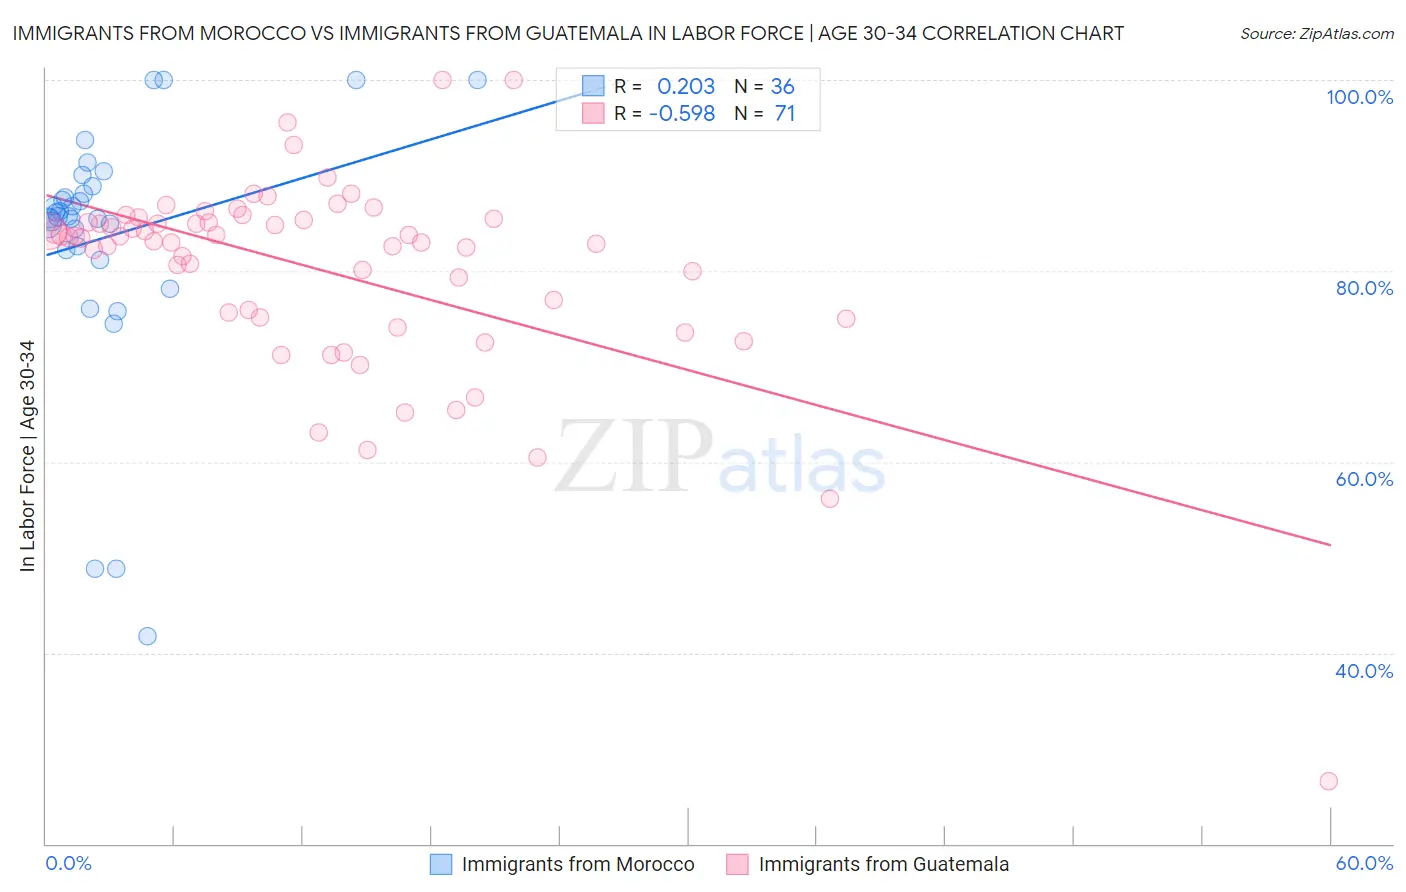
Immigrants from Morocco vs Immigrants from Guatemala In Labor Force | Age 30-34 Correlation Chart
The statistical analysis conducted on geographies consisting of 178,904,869 people shows a weak positive correlation between the proportion of Immigrants from Morocco and labor force participation rate among population between the ages 30 and 34 in the United States with a correlation coefficient (R) of 0.203 and weighted average of 85.6%. Similarly, the statistical analysis conducted on geographies consisting of 377,154,484 people shows a substantial negative correlation between the proportion of Immigrants from Guatemala and labor force participation rate among population between the ages 30 and 34 in the United States with a correlation coefficient (R) of -0.598 and weighted average of 83.7%, a difference of 2.3%.
In Labor Force | Age 30-34 Correlation Summary
| Measurement | Immigrants from Morocco | Immigrants from Guatemala |
| Minimum | 41.7% | 26.6% |
| Maximum | 100.0% | 100.0% |
| Range | 58.3% | 73.4% |
| Mean | 83.6% | 80.1% |
| Median | 85.7% | 83.5% |
| Interquartile 25% (IQ1) | 82.4% | 75.1% |
| Interquartile 75% (IQ3) | 88.5% | 85.3% |
| Interquartile Range (IQR) | 6.1% | 10.2% |
| Standard Deviation (Sample) | 13.0% | 10.6% |
| Standard Deviation (Population) | 12.8% | 10.6% |
Similar Demographics by In Labor Force | Age 30-34
Demographics Similar to Immigrants from Morocco by In Labor Force | Age 30-34
In terms of in labor force | age 30-34, the demographic groups most similar to Immigrants from Morocco are Croatian (85.6%, a difference of 0.0%), Immigrants from Sri Lanka (85.6%, a difference of 0.010%), Immigrants from Nepal (85.6%, a difference of 0.010%), Immigrants from Sweden (85.6%, a difference of 0.020%), and Lithuanian (85.6%, a difference of 0.020%).
| Demographics | Rating | Rank | In Labor Force | Age 30-34 |
| Eastern Europeans | 99.9 /100 | #39 | Exceptional 85.7% |
| Turks | 99.9 /100 | #40 | Exceptional 85.7% |
| Immigrants | Italy | 99.9 /100 | #41 | Exceptional 85.7% |
| Zimbabweans | 99.8 /100 | #42 | Exceptional 85.6% |
| Immigrants | Lithuania | 99.8 /100 | #43 | Exceptional 85.6% |
| Immigrants | Sri Lanka | 99.8 /100 | #44 | Exceptional 85.6% |
| Immigrants | Nepal | 99.8 /100 | #45 | Exceptional 85.6% |
| Immigrants | Morocco | 99.8 /100 | #46 | Exceptional 85.6% |
| Croatians | 99.8 /100 | #47 | Exceptional 85.6% |
| Immigrants | Sweden | 99.8 /100 | #48 | Exceptional 85.6% |
| Lithuanians | 99.8 /100 | #49 | Exceptional 85.6% |
| Immigrants | Australia | 99.8 /100 | #50 | Exceptional 85.6% |
| Cape Verdeans | 99.7 /100 | #51 | Exceptional 85.6% |
| Slovenes | 99.7 /100 | #52 | Exceptional 85.6% |
| Filipinos | 99.6 /100 | #53 | Exceptional 85.5% |
Demographics Similar to Immigrants from Guatemala by In Labor Force | Age 30-34
In terms of in labor force | age 30-34, the demographic groups most similar to Immigrants from Guatemala are Immigrants from Honduras (83.7%, a difference of 0.020%), Guatemalan (83.7%, a difference of 0.050%), Immigrants from Guyana (83.8%, a difference of 0.090%), Dominican (83.8%, a difference of 0.10%), and Spaniard (83.6%, a difference of 0.10%).
| Demographics | Rating | Rank | In Labor Force | Age 30-34 |
| Scotch-Irish | 0.3 /100 | #259 | Tragic 83.8% |
| Immigrants | Dominican Republic | 0.3 /100 | #260 | Tragic 83.8% |
| Guyanese | 0.3 /100 | #261 | Tragic 83.8% |
| Dominicans | 0.2 /100 | #262 | Tragic 83.8% |
| Immigrants | Guyana | 0.2 /100 | #263 | Tragic 83.8% |
| Guatemalans | 0.2 /100 | #264 | Tragic 83.7% |
| Immigrants | Honduras | 0.1 /100 | #265 | Tragic 83.7% |
| Immigrants | Guatemala | 0.1 /100 | #266 | Tragic 83.7% |
| Spaniards | 0.1 /100 | #267 | Tragic 83.6% |
| Immigrants | Bangladesh | 0.1 /100 | #268 | Tragic 83.6% |
| Vietnamese | 0.1 /100 | #269 | Tragic 83.6% |
| Spanish Americans | 0.0 /100 | #270 | Tragic 83.5% |
| Spanish | 0.0 /100 | #271 | Tragic 83.5% |
| Immigrants | Nonimmigrants | 0.0 /100 | #272 | Tragic 83.5% |
| Guamanians/Chamorros | 0.0 /100 | #273 | Tragic 83.5% |