Immigrants from Albania vs French Canadian GED/Equivalency
COMPARE
Immigrants from Albania
French Canadian
GED/Equivalency
GED/Equivalency Comparison
Immigrants from Albania
French Canadians
86.0%
GED/EQUIVALENCY
64.2/ 100
METRIC RATING
166th/ 347
METRIC RANK
86.9%
GED/EQUIVALENCY
93.2/ 100
METRIC RATING
118th/ 347
METRIC RANK
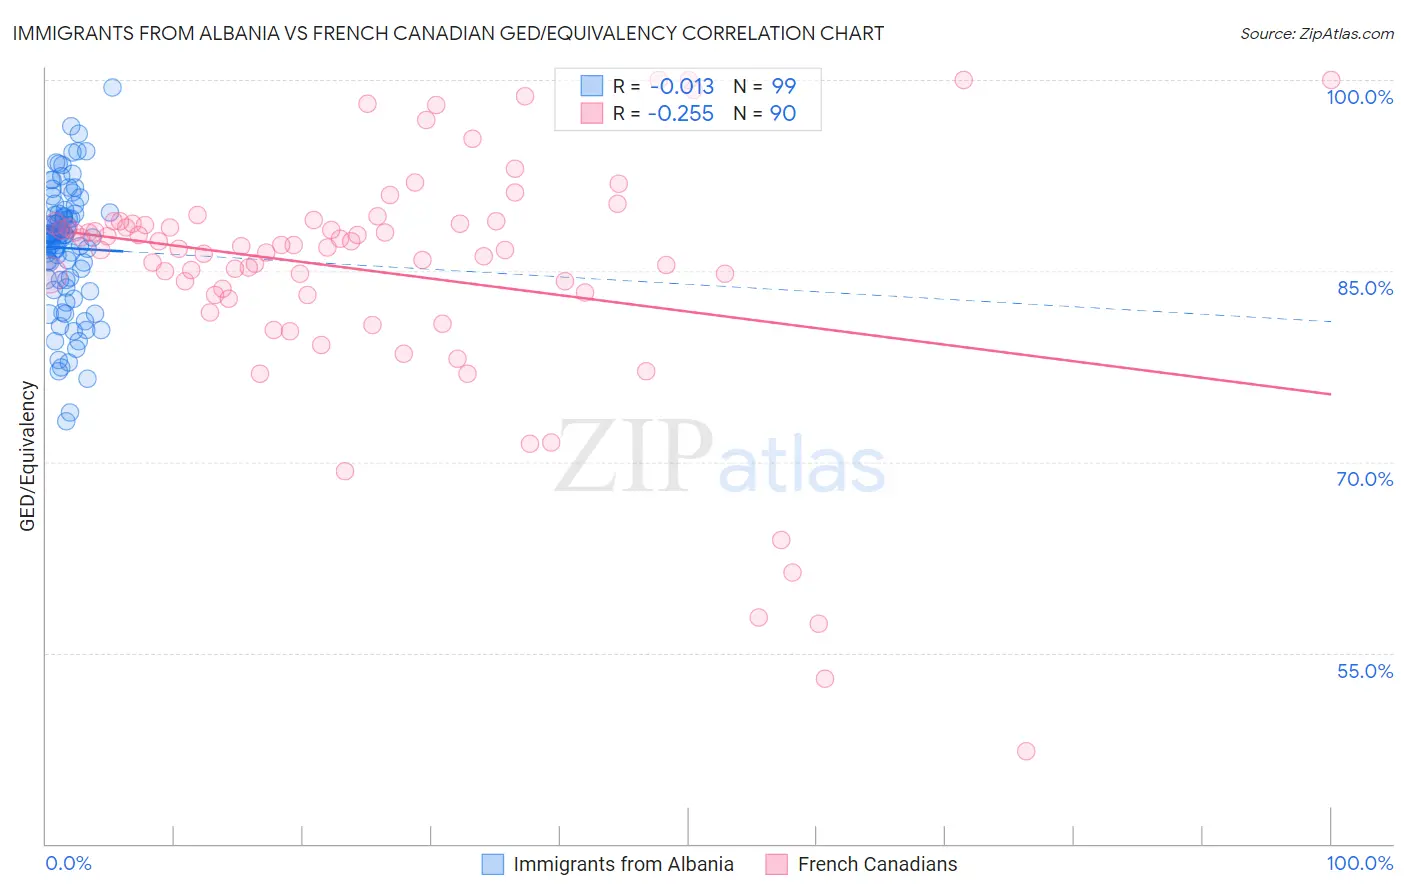
Immigrants from Albania vs French Canadian GED/Equivalency Correlation Chart
The statistical analysis conducted on geographies consisting of 119,401,336 people shows no correlation between the proportion of Immigrants from Albania and percentage of population with at least ged/equivalency education in the United States with a correlation coefficient (R) of -0.013 and weighted average of 86.0%. Similarly, the statistical analysis conducted on geographies consisting of 502,679,937 people shows a weak negative correlation between the proportion of French Canadians and percentage of population with at least ged/equivalency education in the United States with a correlation coefficient (R) of -0.255 and weighted average of 86.9%, a difference of 1.0%.
GED/Equivalency Correlation Summary
| Measurement | Immigrants from Albania | French Canadian |
| Minimum | 73.2% | 47.3% |
| Maximum | 99.4% | 100.0% |
| Range | 26.2% | 52.7% |
| Mean | 86.8% | 84.9% |
| Median | 87.8% | 86.9% |
| Interquartile 25% (IQ1) | 84.3% | 83.1% |
| Interquartile 75% (IQ3) | 89.5% | 88.7% |
| Interquartile Range (IQR) | 5.2% | 5.6% |
| Standard Deviation (Sample) | 4.9% | 9.8% |
| Standard Deviation (Population) | 4.9% | 9.7% |
Similar Demographics by GED/Equivalency
Demographics Similar to Immigrants from Albania by GED/Equivalency
In terms of ged/equivalency, the demographic groups most similar to Immigrants from Albania are Alsatian (86.0%, a difference of 0.0%), Ethiopian (86.0%, a difference of 0.010%), Venezuelan (86.0%, a difference of 0.030%), Ugandan (86.1%, a difference of 0.050%), and Sierra Leonean (86.0%, a difference of 0.050%).
| Demographics | Rating | Rank | GED/Equivalency |
| Immigrants | Kenya | 71.8 /100 | #159 | Good 86.2% |
| Immigrants | Morocco | 69.5 /100 | #160 | Good 86.1% |
| Immigrants | Syria | 69.3 /100 | #161 | Good 86.1% |
| Immigrants | Iraq | 68.1 /100 | #162 | Good 86.1% |
| Ugandans | 66.3 /100 | #163 | Good 86.1% |
| Venezuelans | 65.5 /100 | #164 | Good 86.0% |
| Alsatians | 64.3 /100 | #165 | Good 86.0% |
| Immigrants | Albania | 64.2 /100 | #166 | Good 86.0% |
| Ethiopians | 63.7 /100 | #167 | Good 86.0% |
| Sierra Leoneans | 61.8 /100 | #168 | Good 86.0% |
| Immigrants | Ethiopia | 61.2 /100 | #169 | Good 86.0% |
| Afghans | 59.7 /100 | #170 | Average 85.9% |
| Immigrants | Chile | 57.3 /100 | #171 | Average 85.9% |
| Bermudans | 55.1 /100 | #172 | Average 85.8% |
| Immigrants | Venezuela | 50.7 /100 | #173 | Average 85.8% |
Demographics Similar to French Canadians by GED/Equivalency
In terms of ged/equivalency, the demographic groups most similar to French Canadians are Immigrants from China (86.9%, a difference of 0.0%), Immigrants from Hong Kong (86.9%, a difference of 0.050%), Swiss (87.0%, a difference of 0.11%), Scotch-Irish (86.8%, a difference of 0.12%), and Immigrants from Kazakhstan (87.0%, a difference of 0.13%).
| Demographics | Rating | Rank | GED/Equivalency |
| French | 95.2 /100 | #111 | Exceptional 87.1% |
| Tlingit-Haida | 94.8 /100 | #112 | Exceptional 87.0% |
| Assyrians/Chaldeans/Syriacs | 94.8 /100 | #113 | Exceptional 87.0% |
| Immigrants | Kazakhstan | 94.7 /100 | #114 | Exceptional 87.0% |
| Mongolians | 94.6 /100 | #115 | Exceptional 87.0% |
| Swiss | 94.5 /100 | #116 | Exceptional 87.0% |
| Immigrants | Hong Kong | 93.8 /100 | #117 | Exceptional 86.9% |
| French Canadians | 93.2 /100 | #118 | Exceptional 86.9% |
| Immigrants | China | 93.2 /100 | #119 | Exceptional 86.9% |
| Scotch-Irish | 91.6 /100 | #120 | Exceptional 86.8% |
| Immigrants | Lebanon | 90.9 /100 | #121 | Exceptional 86.8% |
| Immigrants | Jordan | 90.8 /100 | #122 | Exceptional 86.8% |
| Immigrants | Italy | 90.5 /100 | #123 | Exceptional 86.7% |
| Immigrants | Egypt | 90.4 /100 | #124 | Exceptional 86.7% |
| Celtics | 90.4 /100 | #125 | Exceptional 86.7% |