Immigrants from Malaysia vs Fijian Divorced or Separated
COMPARE
Immigrants from Malaysia
Fijian
Divorced or Separated
Divorced or Separated Comparison
Immigrants from Malaysia
Fijians
11.0%
DIVORCED OR SEPARATED
100.0/ 100
METRIC RATING
28th/ 347
METRIC RANK
12.6%
DIVORCED OR SEPARATED
0.4/ 100
METRIC RATING
268th/ 347
METRIC RANK
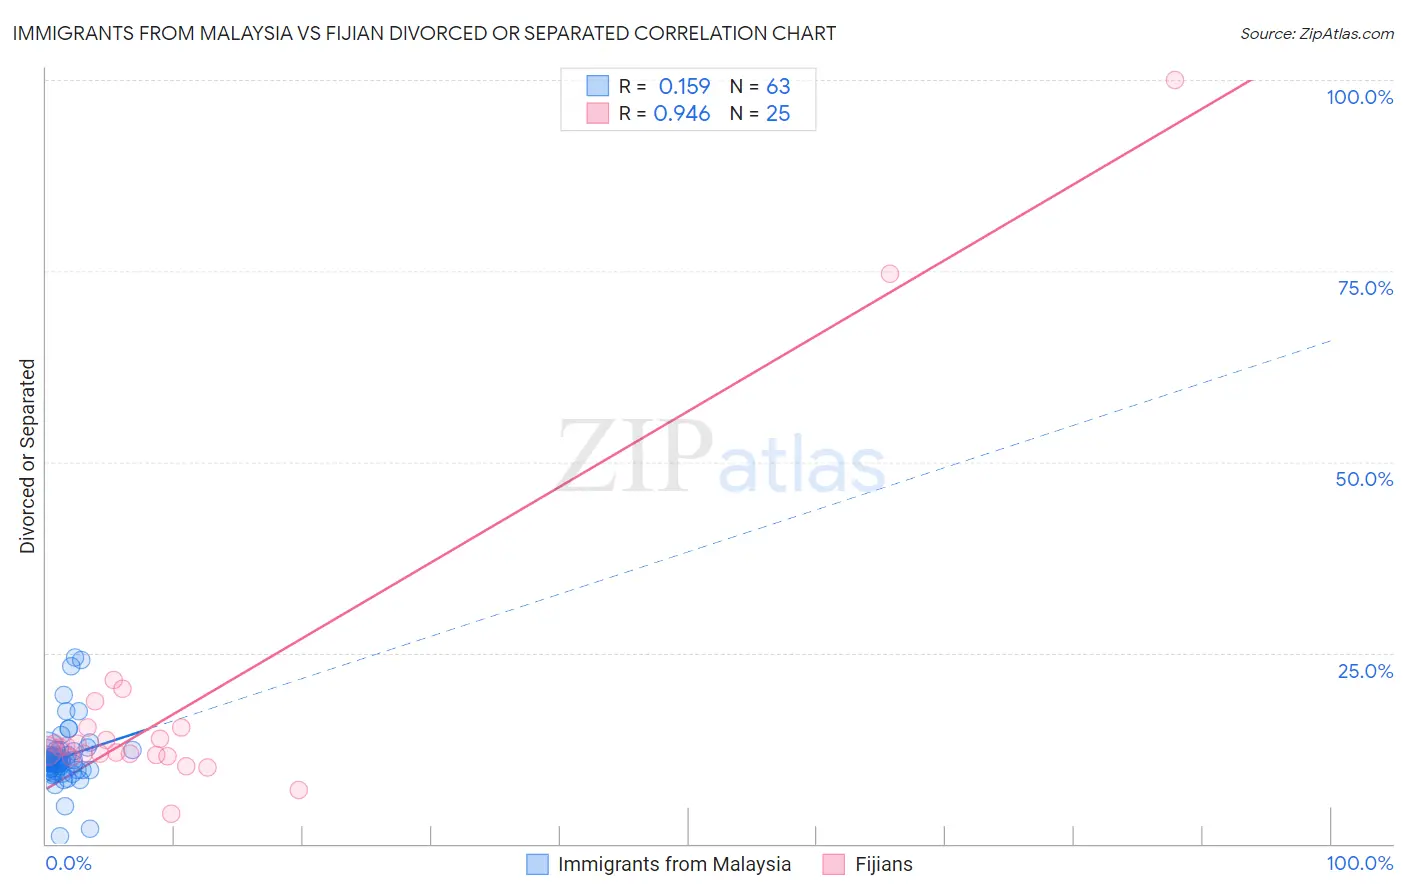
Immigrants from Malaysia vs Fijian Divorced or Separated Correlation Chart
The statistical analysis conducted on geographies consisting of 197,936,479 people shows a poor positive correlation between the proportion of Immigrants from Malaysia and percentage of population currently divorced or separated in the United States with a correlation coefficient (R) of 0.159 and weighted average of 11.0%. Similarly, the statistical analysis conducted on geographies consisting of 55,948,408 people shows a near-perfect positive correlation between the proportion of Fijians and percentage of population currently divorced or separated in the United States with a correlation coefficient (R) of 0.946 and weighted average of 12.6%, a difference of 15.1%.
Divorced or Separated Correlation Summary
| Measurement | Immigrants from Malaysia | Fijian |
| Minimum | 1.0% | 4.0% |
| Maximum | 24.4% | 100.0% |
| Range | 23.4% | 96.0% |
| Mean | 11.4% | 18.8% |
| Median | 10.8% | 12.6% |
| Interquartile 25% (IQ1) | 9.6% | 11.6% |
| Interquartile 75% (IQ3) | 12.1% | 15.3% |
| Interquartile Range (IQR) | 2.5% | 3.7% |
| Standard Deviation (Sample) | 4.0% | 21.3% |
| Standard Deviation (Population) | 4.0% | 20.8% |
Similar Demographics by Divorced or Separated
Demographics Similar to Immigrants from Malaysia by Divorced or Separated
In terms of divorced or separated, the demographic groups most similar to Immigrants from Malaysia are Immigrants from Bangladesh (11.0%, a difference of 0.030%), Armenian (11.0%, a difference of 0.070%), Immigrants from Indonesia (10.9%, a difference of 0.47%), Immigrants from Ireland (11.0%, a difference of 0.59%), and Mongolian (11.1%, a difference of 0.89%).
| Demographics | Rating | Rank | Divorced or Separated |
| Immigrants | Asia | 100.0 /100 | #21 | Exceptional 10.7% |
| Vietnamese | 100.0 /100 | #22 | Exceptional 10.8% |
| Immigrants | Pakistan | 100.0 /100 | #23 | Exceptional 10.8% |
| Immigrants | Sri Lanka | 100.0 /100 | #24 | Exceptional 10.8% |
| Iranians | 100.0 /100 | #25 | Exceptional 10.8% |
| Immigrants | Indonesia | 100.0 /100 | #26 | Exceptional 10.9% |
| Immigrants | Bangladesh | 100.0 /100 | #27 | Exceptional 11.0% |
| Immigrants | Malaysia | 100.0 /100 | #28 | Exceptional 11.0% |
| Armenians | 100.0 /100 | #29 | Exceptional 11.0% |
| Immigrants | Ireland | 100.0 /100 | #30 | Exceptional 11.0% |
| Mongolians | 100.0 /100 | #31 | Exceptional 11.1% |
| Tongans | 100.0 /100 | #32 | Exceptional 11.1% |
| Egyptians | 100.0 /100 | #33 | Exceptional 11.1% |
| Immigrants | Uzbekistan | 100.0 /100 | #34 | Exceptional 11.1% |
| Cambodians | 100.0 /100 | #35 | Exceptional 11.1% |
Demographics Similar to Fijians by Divorced or Separated
In terms of divorced or separated, the demographic groups most similar to Fijians are Scottish (12.6%, a difference of 0.010%), Immigrants from Liberia (12.6%, a difference of 0.010%), White/Caucasian (12.6%, a difference of 0.060%), Immigrants from Senegal (12.6%, a difference of 0.070%), and English (12.6%, a difference of 0.080%).
| Demographics | Rating | Rank | Divorced or Separated |
| Immigrants | Dominica | 0.5 /100 | #261 | Tragic 12.6% |
| Basques | 0.5 /100 | #262 | Tragic 12.6% |
| Immigrants | Panama | 0.5 /100 | #263 | Tragic 12.6% |
| English | 0.5 /100 | #264 | Tragic 12.6% |
| Immigrants | Senegal | 0.5 /100 | #265 | Tragic 12.6% |
| Whites/Caucasians | 0.5 /100 | #266 | Tragic 12.6% |
| Scottish | 0.4 /100 | #267 | Tragic 12.6% |
| Fijians | 0.4 /100 | #268 | Tragic 12.6% |
| Immigrants | Liberia | 0.4 /100 | #269 | Tragic 12.6% |
| Ute | 0.4 /100 | #270 | Tragic 12.6% |
| Panamanians | 0.3 /100 | #271 | Tragic 12.7% |
| Immigrants | Middle Africa | 0.3 /100 | #272 | Tragic 12.7% |
| Immigrants | Micronesia | 0.3 /100 | #273 | Tragic 12.7% |
| Bermudans | 0.3 /100 | #274 | Tragic 12.7% |
| Central American Indians | 0.3 /100 | #275 | Tragic 12.7% |