Immigrants from El Salvador vs Fijian GED/Equivalency
COMPARE
Immigrants from El Salvador
Fijian
GED/Equivalency
GED/Equivalency Comparison
Immigrants from El Salvador
Fijians
77.6%
GED/EQUIVALENCY
0.0/ 100
METRIC RATING
339th/ 347
METRIC RANK
81.6%
GED/EQUIVALENCY
0.0/ 100
METRIC RATING
300th/ 347
METRIC RANK
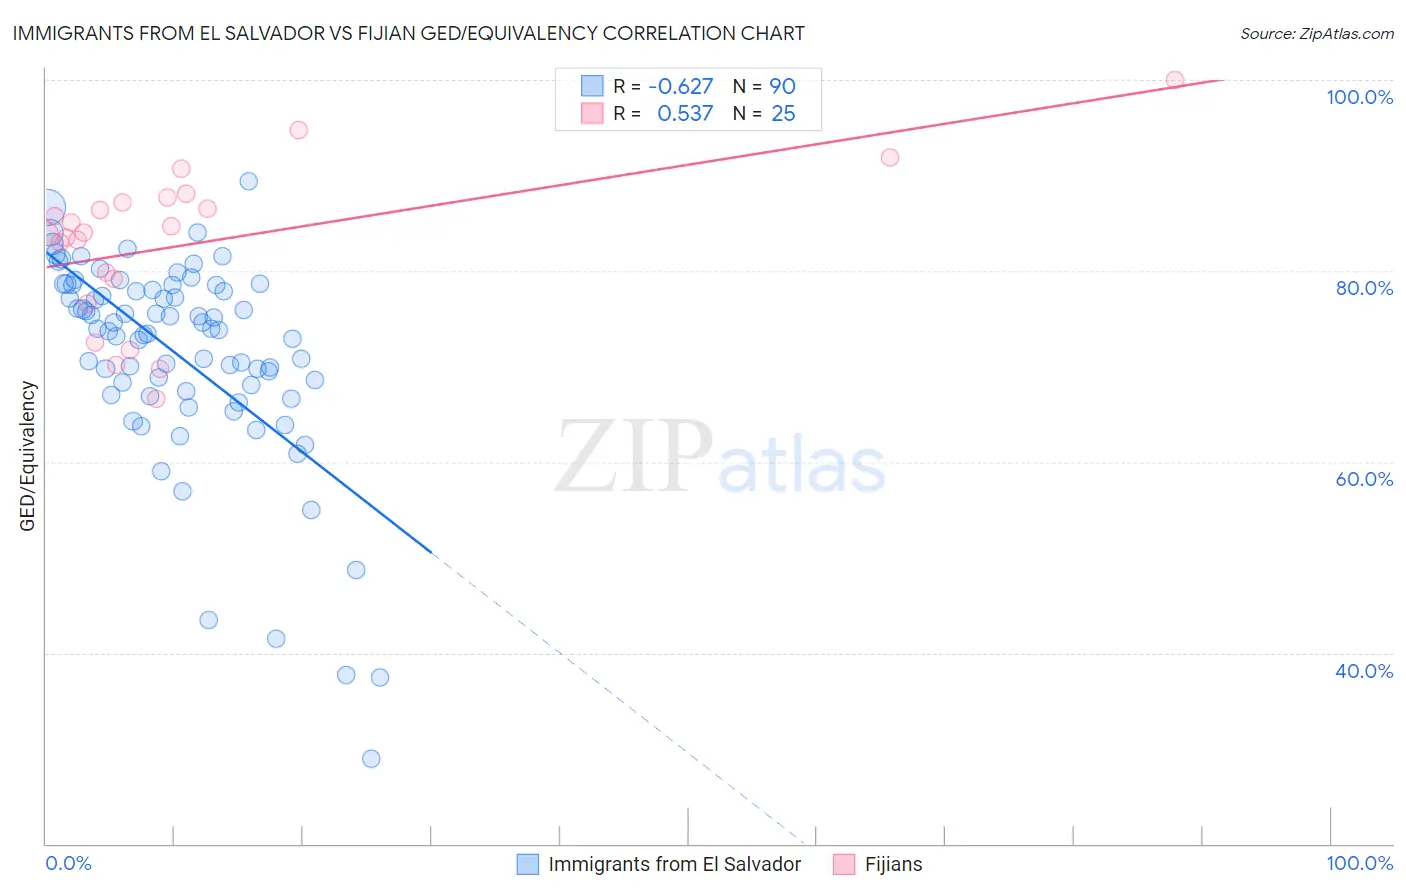
Immigrants from El Salvador vs Fijian GED/Equivalency Correlation Chart
The statistical analysis conducted on geographies consisting of 357,852,938 people shows a significant negative correlation between the proportion of Immigrants from El Salvador and percentage of population with at least ged/equivalency education in the United States with a correlation coefficient (R) of -0.627 and weighted average of 77.6%. Similarly, the statistical analysis conducted on geographies consisting of 55,948,842 people shows a substantial positive correlation between the proportion of Fijians and percentage of population with at least ged/equivalency education in the United States with a correlation coefficient (R) of 0.537 and weighted average of 81.6%, a difference of 5.2%.
GED/Equivalency Correlation Summary
| Measurement | Immigrants from El Salvador | Fijian |
| Minimum | 29.0% | 66.7% |
| Maximum | 89.4% | 100.0% |
| Range | 60.4% | 33.3% |
| Mean | 71.2% | 82.9% |
| Median | 73.8% | 84.0% |
| Interquartile 25% (IQ1) | 67.4% | 77.9% |
| Interquartile 75% (IQ3) | 78.5% | 87.4% |
| Interquartile Range (IQR) | 11.1% | 9.6% |
| Standard Deviation (Sample) | 10.9% | 8.1% |
| Standard Deviation (Population) | 10.8% | 8.0% |
Similar Demographics by GED/Equivalency
Demographics Similar to Immigrants from El Salvador by GED/Equivalency
In terms of ged/equivalency, the demographic groups most similar to Immigrants from El Salvador are Tohono O'odham (77.5%, a difference of 0.16%), Mexican (77.4%, a difference of 0.24%), Immigrants from Guatemala (77.9%, a difference of 0.38%), Immigrants from Yemen (77.9%, a difference of 0.41%), and Immigrants from Dominican Republic (78.0%, a difference of 0.47%).
| Demographics | Rating | Rank | GED/Equivalency |
| Immigrants | Azores | 0.0 /100 | #332 | Tragic 78.7% |
| Salvadorans | 0.0 /100 | #333 | Tragic 78.6% |
| Guatemalans | 0.0 /100 | #334 | Tragic 78.5% |
| Immigrants | Latin America | 0.0 /100 | #335 | Tragic 78.5% |
| Immigrants | Dominican Republic | 0.0 /100 | #336 | Tragic 78.0% |
| Immigrants | Yemen | 0.0 /100 | #337 | Tragic 77.9% |
| Immigrants | Guatemala | 0.0 /100 | #338 | Tragic 77.9% |
| Immigrants | El Salvador | 0.0 /100 | #339 | Tragic 77.6% |
| Tohono O'odham | 0.0 /100 | #340 | Tragic 77.5% |
| Mexicans | 0.0 /100 | #341 | Tragic 77.4% |
| Pima | 0.0 /100 | #342 | Tragic 76.4% |
| Immigrants | Central America | 0.0 /100 | #343 | Tragic 76.4% |
| Spanish American Indians | 0.0 /100 | #344 | Tragic 76.3% |
| Immigrants | Mexico | 0.0 /100 | #345 | Tragic 75.7% |
| Houma | 0.0 /100 | #346 | Tragic 75.0% |
Demographics Similar to Fijians by GED/Equivalency
In terms of ged/equivalency, the demographic groups most similar to Fijians are Dutch West Indian (81.6%, a difference of 0.060%), Ecuadorian (81.7%, a difference of 0.070%), Immigrants from Haiti (81.6%, a difference of 0.10%), Immigrants from Portugal (81.6%, a difference of 0.10%), and Ute (81.8%, a difference of 0.20%).
| Demographics | Rating | Rank | GED/Equivalency |
| British West Indians | 0.0 /100 | #293 | Tragic 82.0% |
| Immigrants | St. Vincent and the Grenadines | 0.0 /100 | #294 | Tragic 82.0% |
| Nepalese | 0.0 /100 | #295 | Tragic 81.9% |
| Vietnamese | 0.0 /100 | #296 | Tragic 81.9% |
| Immigrants | Bangladesh | 0.0 /100 | #297 | Tragic 81.9% |
| Ute | 0.0 /100 | #298 | Tragic 81.8% |
| Ecuadorians | 0.0 /100 | #299 | Tragic 81.7% |
| Fijians | 0.0 /100 | #300 | Tragic 81.6% |
| Dutch West Indians | 0.0 /100 | #301 | Tragic 81.6% |
| Immigrants | Haiti | 0.0 /100 | #302 | Tragic 81.6% |
| Immigrants | Portugal | 0.0 /100 | #303 | Tragic 81.6% |
| Navajo | 0.0 /100 | #304 | Tragic 81.5% |
| Immigrants | Grenada | 0.0 /100 | #305 | Tragic 81.3% |
| Guyanese | 0.0 /100 | #306 | Tragic 81.3% |
| Immigrants | Dominica | 0.0 /100 | #307 | Tragic 81.1% |