Immigrants from Latin America vs Immigrants from Chile College, Under 1 year
COMPARE
Immigrants from Latin America
Immigrants from Chile
College, Under 1 year
College, Under 1 year Comparison
Immigrants from Latin America
Immigrants from Chile
56.3%
COLLEGE, UNDER 1 YEAR
0.0/ 100
METRIC RATING
325th/ 347
METRIC RANK
66.8%
COLLEGE, UNDER 1 YEAR
87.4/ 100
METRIC RATING
137th/ 347
METRIC RANK
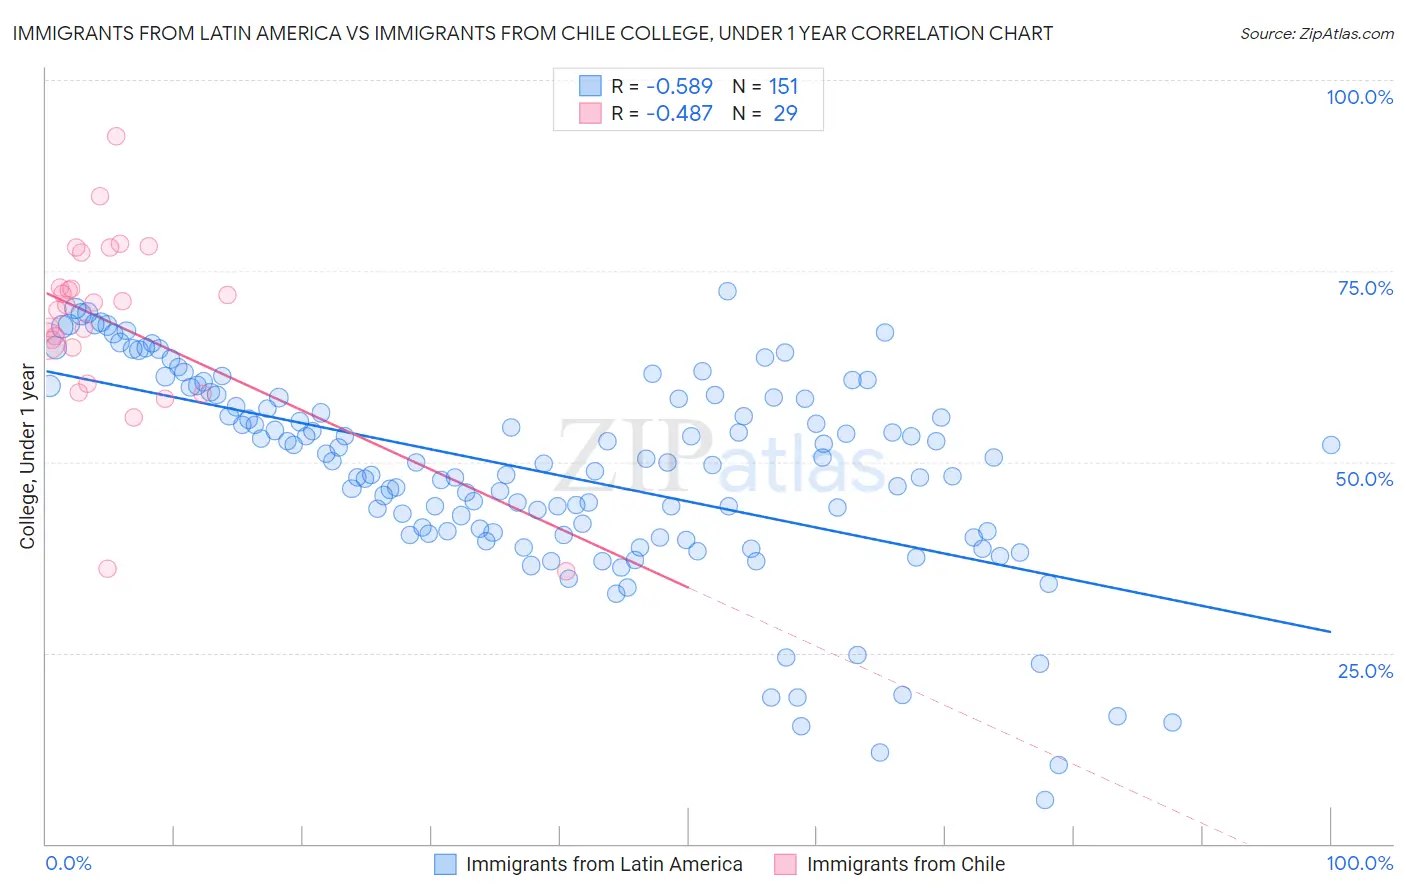
Immigrants from Latin America vs Immigrants from Chile College, Under 1 year Correlation Chart
The statistical analysis conducted on geographies consisting of 558,640,127 people shows a substantial negative correlation between the proportion of Immigrants from Latin America and percentage of population with at least college, under 1 year education in the United States with a correlation coefficient (R) of -0.589 and weighted average of 56.3%. Similarly, the statistical analysis conducted on geographies consisting of 218,647,266 people shows a moderate negative correlation between the proportion of Immigrants from Chile and percentage of population with at least college, under 1 year education in the United States with a correlation coefficient (R) of -0.487 and weighted average of 66.8%, a difference of 18.6%.
College, Under 1 year Correlation Summary
| Measurement | Immigrants from Latin America | Immigrants from Chile |
| Minimum | 5.7% | 35.7% |
| Maximum | 72.4% | 92.6% |
| Range | 66.6% | 56.9% |
| Mean | 48.7% | 68.1% |
| Median | 50.0% | 70.6% |
| Interquartile 25% (IQ1) | 40.7% | 62.6% |
| Interquartile 75% (IQ3) | 58.5% | 75.1% |
| Interquartile Range (IQR) | 17.7% | 12.5% |
| Standard Deviation (Sample) | 13.4% | 12.1% |
| Standard Deviation (Population) | 13.3% | 11.9% |
Similar Demographics by College, Under 1 year
Demographics Similar to Immigrants from Latin America by College, Under 1 year
In terms of college, under 1 year, the demographic groups most similar to Immigrants from Latin America are Immigrants from El Salvador (56.4%, a difference of 0.10%), Navajo (56.3%, a difference of 0.15%), Immigrants from Honduras (56.5%, a difference of 0.23%), Immigrants from Guatemala (56.2%, a difference of 0.24%), and Immigrants from Caribbean (56.6%, a difference of 0.41%).
| Demographics | Rating | Rank | College, Under 1 year |
| Immigrants | Haiti | 0.0 /100 | #318 | Tragic 56.9% |
| Puerto Ricans | 0.0 /100 | #319 | Tragic 56.8% |
| Guatemalans | 0.0 /100 | #320 | Tragic 56.8% |
| Natives/Alaskans | 0.0 /100 | #321 | Tragic 56.6% |
| Immigrants | Caribbean | 0.0 /100 | #322 | Tragic 56.6% |
| Immigrants | Honduras | 0.0 /100 | #323 | Tragic 56.5% |
| Immigrants | El Salvador | 0.0 /100 | #324 | Tragic 56.4% |
| Immigrants | Latin America | 0.0 /100 | #325 | Tragic 56.3% |
| Navajo | 0.0 /100 | #326 | Tragic 56.3% |
| Immigrants | Guatemala | 0.0 /100 | #327 | Tragic 56.2% |
| Cape Verdeans | 0.0 /100 | #328 | Tragic 56.0% |
| Immigrants | Cuba | 0.0 /100 | #329 | Tragic 55.7% |
| Mexicans | 0.0 /100 | #330 | Tragic 55.6% |
| Dominicans | 0.0 /100 | #331 | Tragic 55.5% |
| Immigrants | Yemen | 0.0 /100 | #332 | Tragic 55.3% |
Demographics Similar to Immigrants from Chile by College, Under 1 year
In terms of college, under 1 year, the demographic groups most similar to Immigrants from Chile are Ugandan (66.8%, a difference of 0.040%), Canadian (66.8%, a difference of 0.050%), Immigrants from Italy (66.8%, a difference of 0.050%), Iraqi (66.8%, a difference of 0.060%), and Immigrants from Brazil (66.9%, a difference of 0.090%).
| Demographics | Rating | Rank | College, Under 1 year |
| Immigrants | Syria | 89.0 /100 | #130 | Excellent 66.9% |
| Finns | 88.6 /100 | #131 | Excellent 66.9% |
| Poles | 88.4 /100 | #132 | Excellent 66.9% |
| Immigrants | Brazil | 88.3 /100 | #133 | Excellent 66.9% |
| Iraqis | 88.0 /100 | #134 | Excellent 66.8% |
| Canadians | 87.9 /100 | #135 | Excellent 66.8% |
| Ugandans | 87.8 /100 | #136 | Excellent 66.8% |
| Immigrants | Chile | 87.4 /100 | #137 | Excellent 66.8% |
| Immigrants | Italy | 86.9 /100 | #138 | Excellent 66.8% |
| Venezuelans | 85.9 /100 | #139 | Excellent 66.7% |
| Slavs | 85.9 /100 | #140 | Excellent 66.7% |
| Immigrants | Afghanistan | 85.1 /100 | #141 | Excellent 66.7% |
| English | 82.9 /100 | #142 | Excellent 66.6% |
| Immigrants | Uganda | 82.8 /100 | #143 | Excellent 66.5% |
| Immigrants | Germany | 82.0 /100 | #144 | Excellent 66.5% |