Immigrants from Bosnia and Herzegovina vs Immigrants from Chile College, Under 1 year
COMPARE
Immigrants from Bosnia and Herzegovina
Immigrants from Chile
College, Under 1 year
College, Under 1 year Comparison
Immigrants from Bosnia and Herzegovina
Immigrants from Chile
65.4%
COLLEGE, UNDER 1 YEAR
50.0/ 100
METRIC RATING
174th/ 347
METRIC RANK
66.8%
COLLEGE, UNDER 1 YEAR
87.4/ 100
METRIC RATING
137th/ 347
METRIC RANK
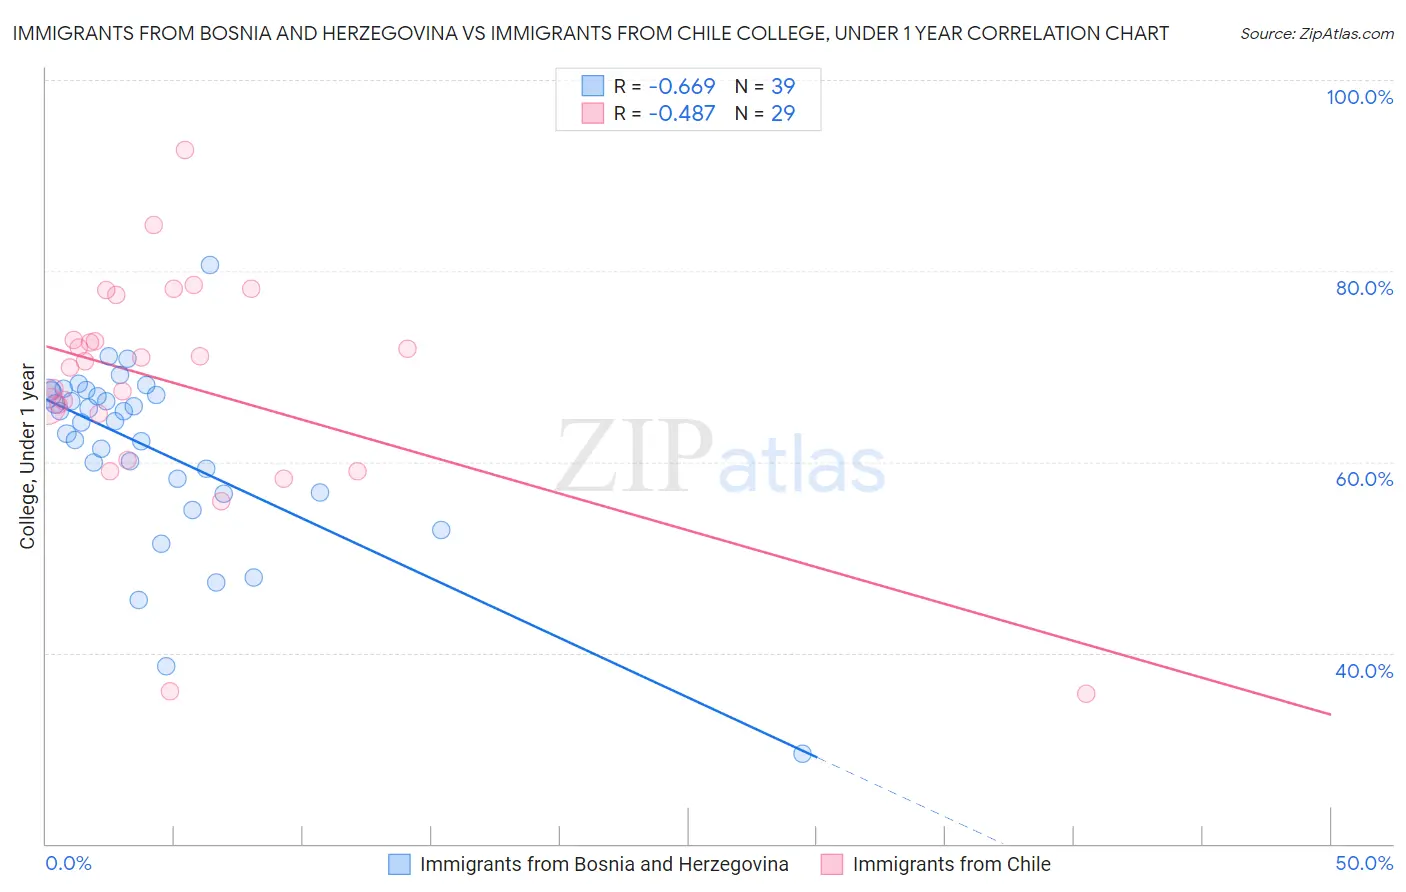
Immigrants from Bosnia and Herzegovina vs Immigrants from Chile College, Under 1 year Correlation Chart
The statistical analysis conducted on geographies consisting of 156,819,513 people shows a significant negative correlation between the proportion of Immigrants from Bosnia and Herzegovina and percentage of population with at least college, under 1 year education in the United States with a correlation coefficient (R) of -0.669 and weighted average of 65.4%. Similarly, the statistical analysis conducted on geographies consisting of 218,647,266 people shows a moderate negative correlation between the proportion of Immigrants from Chile and percentage of population with at least college, under 1 year education in the United States with a correlation coefficient (R) of -0.487 and weighted average of 66.8%, a difference of 2.1%.
College, Under 1 year Correlation Summary
| Measurement | Immigrants from Bosnia and Herzegovina | Immigrants from Chile |
| Minimum | 29.4% | 35.7% |
| Maximum | 80.6% | 92.6% |
| Range | 51.2% | 56.9% |
| Mean | 61.3% | 68.1% |
| Median | 64.3% | 70.6% |
| Interquartile 25% (IQ1) | 56.8% | 62.6% |
| Interquartile 75% (IQ3) | 67.2% | 75.1% |
| Interquartile Range (IQR) | 10.4% | 12.5% |
| Standard Deviation (Sample) | 9.6% | 12.1% |
| Standard Deviation (Population) | 9.5% | 11.9% |
Similar Demographics by College, Under 1 year
Demographics Similar to Immigrants from Bosnia and Herzegovina by College, Under 1 year
In terms of college, under 1 year, the demographic groups most similar to Immigrants from Bosnia and Herzegovina are Scotch-Irish (65.4%, a difference of 0.020%), French (65.4%, a difference of 0.050%), Immigrants from North Macedonia (65.4%, a difference of 0.060%), German Russian (65.4%, a difference of 0.080%), and Guamanian/Chamorro (65.4%, a difference of 0.080%).
| Demographics | Rating | Rank | College, Under 1 year |
| Immigrants | Somalia | 56.4 /100 | #167 | Average 65.6% |
| Hungarians | 55.9 /100 | #168 | Average 65.6% |
| Yugoslavians | 55.7 /100 | #169 | Average 65.6% |
| Germans | 55.7 /100 | #170 | Average 65.6% |
| Immigrants | Oceania | 55.0 /100 | #171 | Average 65.6% |
| South American Indians | 54.4 /100 | #172 | Average 65.5% |
| Swiss | 53.9 /100 | #173 | Average 65.5% |
| Immigrants | Bosnia and Herzegovina | 50.0 /100 | #174 | Average 65.4% |
| Scotch-Irish | 49.5 /100 | #175 | Average 65.4% |
| French | 48.9 /100 | #176 | Average 65.4% |
| Immigrants | North Macedonia | 48.6 /100 | #177 | Average 65.4% |
| German Russians | 48.3 /100 | #178 | Average 65.4% |
| Guamanians/Chamorros | 48.2 /100 | #179 | Average 65.4% |
| Dutch | 46.1 /100 | #180 | Average 65.3% |
| Spaniards | 45.5 /100 | #181 | Average 65.3% |
Demographics Similar to Immigrants from Chile by College, Under 1 year
In terms of college, under 1 year, the demographic groups most similar to Immigrants from Chile are Ugandan (66.8%, a difference of 0.040%), Canadian (66.8%, a difference of 0.050%), Immigrants from Italy (66.8%, a difference of 0.050%), Iraqi (66.8%, a difference of 0.060%), and Immigrants from Brazil (66.9%, a difference of 0.090%).
| Demographics | Rating | Rank | College, Under 1 year |
| Immigrants | Syria | 89.0 /100 | #130 | Excellent 66.9% |
| Finns | 88.6 /100 | #131 | Excellent 66.9% |
| Poles | 88.4 /100 | #132 | Excellent 66.9% |
| Immigrants | Brazil | 88.3 /100 | #133 | Excellent 66.9% |
| Iraqis | 88.0 /100 | #134 | Excellent 66.8% |
| Canadians | 87.9 /100 | #135 | Excellent 66.8% |
| Ugandans | 87.8 /100 | #136 | Excellent 66.8% |
| Immigrants | Chile | 87.4 /100 | #137 | Excellent 66.8% |
| Immigrants | Italy | 86.9 /100 | #138 | Excellent 66.8% |
| Venezuelans | 85.9 /100 | #139 | Excellent 66.7% |
| Slavs | 85.9 /100 | #140 | Excellent 66.7% |
| Immigrants | Afghanistan | 85.1 /100 | #141 | Excellent 66.7% |
| English | 82.9 /100 | #142 | Excellent 66.6% |
| Immigrants | Uganda | 82.8 /100 | #143 | Excellent 66.5% |
| Immigrants | Germany | 82.0 /100 | #144 | Excellent 66.5% |