Menominee vs Immigrants from Chile College, Under 1 year
COMPARE
Menominee
Immigrants from Chile
College, Under 1 year
College, Under 1 year Comparison
Menominee
Immigrants from Chile
57.0%
COLLEGE, UNDER 1 YEAR
0.0/ 100
METRIC RATING
316th/ 347
METRIC RANK
66.8%
COLLEGE, UNDER 1 YEAR
87.4/ 100
METRIC RATING
137th/ 347
METRIC RANK
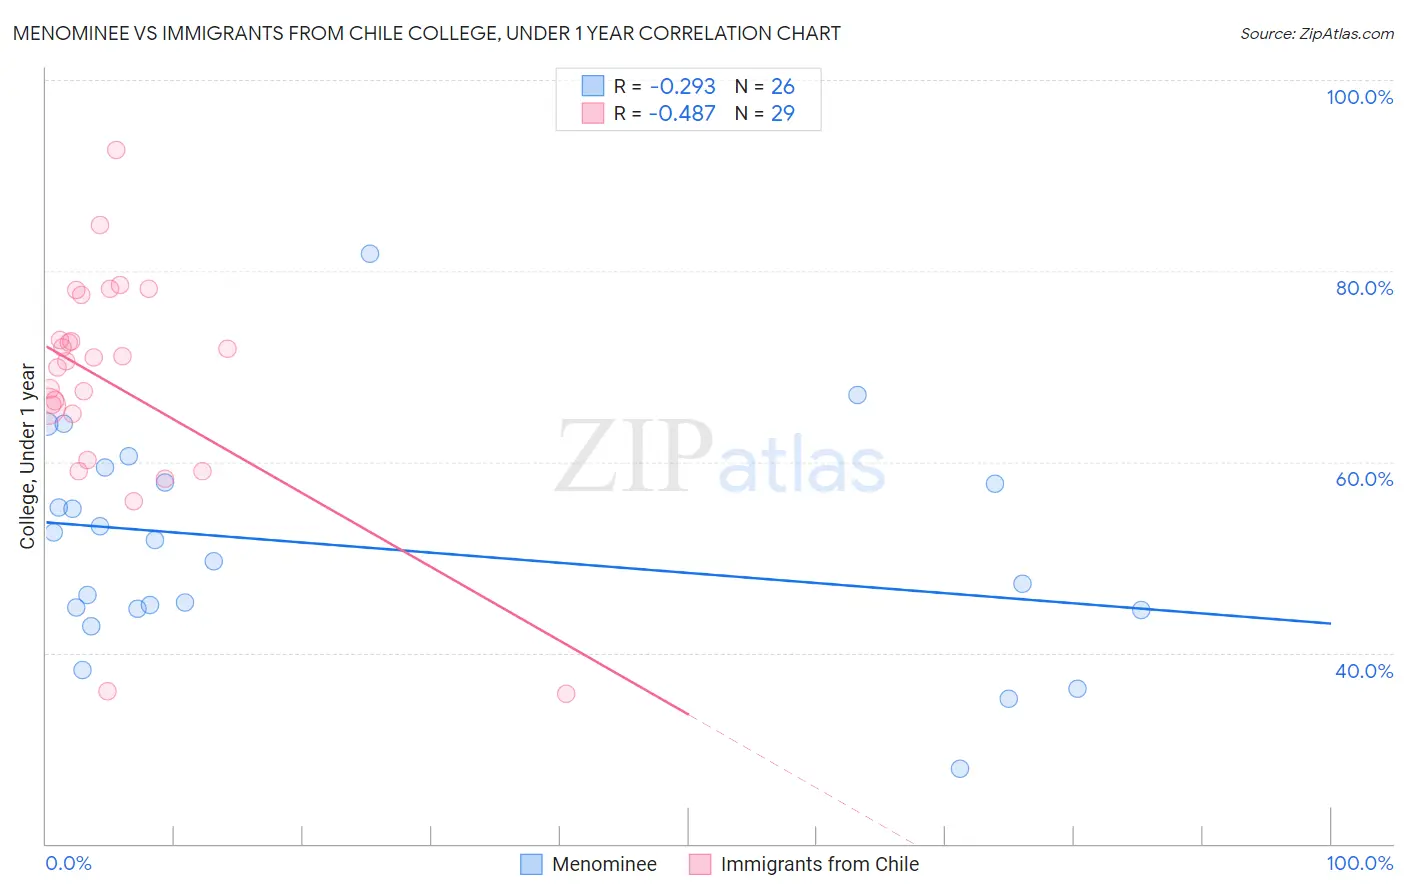
Menominee vs Immigrants from Chile College, Under 1 year Correlation Chart
The statistical analysis conducted on geographies consisting of 45,778,979 people shows a weak negative correlation between the proportion of Menominee and percentage of population with at least college, under 1 year education in the United States with a correlation coefficient (R) of -0.293 and weighted average of 57.0%. Similarly, the statistical analysis conducted on geographies consisting of 218,647,266 people shows a moderate negative correlation between the proportion of Immigrants from Chile and percentage of population with at least college, under 1 year education in the United States with a correlation coefficient (R) of -0.487 and weighted average of 66.8%, a difference of 17.1%.
College, Under 1 year Correlation Summary
| Measurement | Menominee | Immigrants from Chile |
| Minimum | 27.9% | 35.7% |
| Maximum | 81.8% | 92.6% |
| Range | 53.9% | 56.9% |
| Mean | 51.1% | 68.1% |
| Median | 50.7% | 70.6% |
| Interquartile 25% (IQ1) | 44.6% | 62.6% |
| Interquartile 75% (IQ3) | 57.9% | 75.1% |
| Interquartile Range (IQR) | 13.3% | 12.5% |
| Standard Deviation (Sample) | 11.5% | 12.1% |
| Standard Deviation (Population) | 11.3% | 11.9% |
Similar Demographics by College, Under 1 year
Demographics Similar to Menominee by College, Under 1 year
In terms of college, under 1 year, the demographic groups most similar to Menominee are Hispanic or Latino (57.0%, a difference of 0.040%), Honduran (57.1%, a difference of 0.050%), Hopi (57.1%, a difference of 0.10%), Immigrants from Haiti (56.9%, a difference of 0.16%), and Dutch West Indian (57.2%, a difference of 0.22%).
| Demographics | Rating | Rank | College, Under 1 year |
| Immigrants | Nicaragua | 0.0 /100 | #309 | Tragic 57.6% |
| Pueblo | 0.0 /100 | #310 | Tragic 57.4% |
| Cajuns | 0.0 /100 | #311 | Tragic 57.3% |
| Salvadorans | 0.0 /100 | #312 | Tragic 57.3% |
| Dutch West Indians | 0.0 /100 | #313 | Tragic 57.2% |
| Hopi | 0.0 /100 | #314 | Tragic 57.1% |
| Hondurans | 0.0 /100 | #315 | Tragic 57.1% |
| Menominee | 0.0 /100 | #316 | Tragic 57.0% |
| Hispanics or Latinos | 0.0 /100 | #317 | Tragic 57.0% |
| Immigrants | Haiti | 0.0 /100 | #318 | Tragic 56.9% |
| Puerto Ricans | 0.0 /100 | #319 | Tragic 56.8% |
| Guatemalans | 0.0 /100 | #320 | Tragic 56.8% |
| Natives/Alaskans | 0.0 /100 | #321 | Tragic 56.6% |
| Immigrants | Caribbean | 0.0 /100 | #322 | Tragic 56.6% |
| Immigrants | Honduras | 0.0 /100 | #323 | Tragic 56.5% |
Demographics Similar to Immigrants from Chile by College, Under 1 year
In terms of college, under 1 year, the demographic groups most similar to Immigrants from Chile are Ugandan (66.8%, a difference of 0.040%), Canadian (66.8%, a difference of 0.050%), Immigrants from Italy (66.8%, a difference of 0.050%), Iraqi (66.8%, a difference of 0.060%), and Immigrants from Brazil (66.9%, a difference of 0.090%).
| Demographics | Rating | Rank | College, Under 1 year |
| Immigrants | Syria | 89.0 /100 | #130 | Excellent 66.9% |
| Finns | 88.6 /100 | #131 | Excellent 66.9% |
| Poles | 88.4 /100 | #132 | Excellent 66.9% |
| Immigrants | Brazil | 88.3 /100 | #133 | Excellent 66.9% |
| Iraqis | 88.0 /100 | #134 | Excellent 66.8% |
| Canadians | 87.9 /100 | #135 | Excellent 66.8% |
| Ugandans | 87.8 /100 | #136 | Excellent 66.8% |
| Immigrants | Chile | 87.4 /100 | #137 | Excellent 66.8% |
| Immigrants | Italy | 86.9 /100 | #138 | Excellent 66.8% |
| Venezuelans | 85.9 /100 | #139 | Excellent 66.7% |
| Slavs | 85.9 /100 | #140 | Excellent 66.7% |
| Immigrants | Afghanistan | 85.1 /100 | #141 | Excellent 66.7% |
| English | 82.9 /100 | #142 | Excellent 66.6% |
| Immigrants | Uganda | 82.8 /100 | #143 | Excellent 66.5% |
| Immigrants | Germany | 82.0 /100 | #144 | Excellent 66.5% |