Immigrants from Zaire vs Immigrants from Chile College, Under 1 year
COMPARE
Immigrants from Zaire
Immigrants from Chile
College, Under 1 year
College, Under 1 year Comparison
Immigrants from Zaire
Immigrants from Chile
64.1%
COLLEGE, UNDER 1 YEAR
14.6/ 100
METRIC RATING
204th/ 347
METRIC RANK
66.8%
COLLEGE, UNDER 1 YEAR
87.4/ 100
METRIC RATING
137th/ 347
METRIC RANK
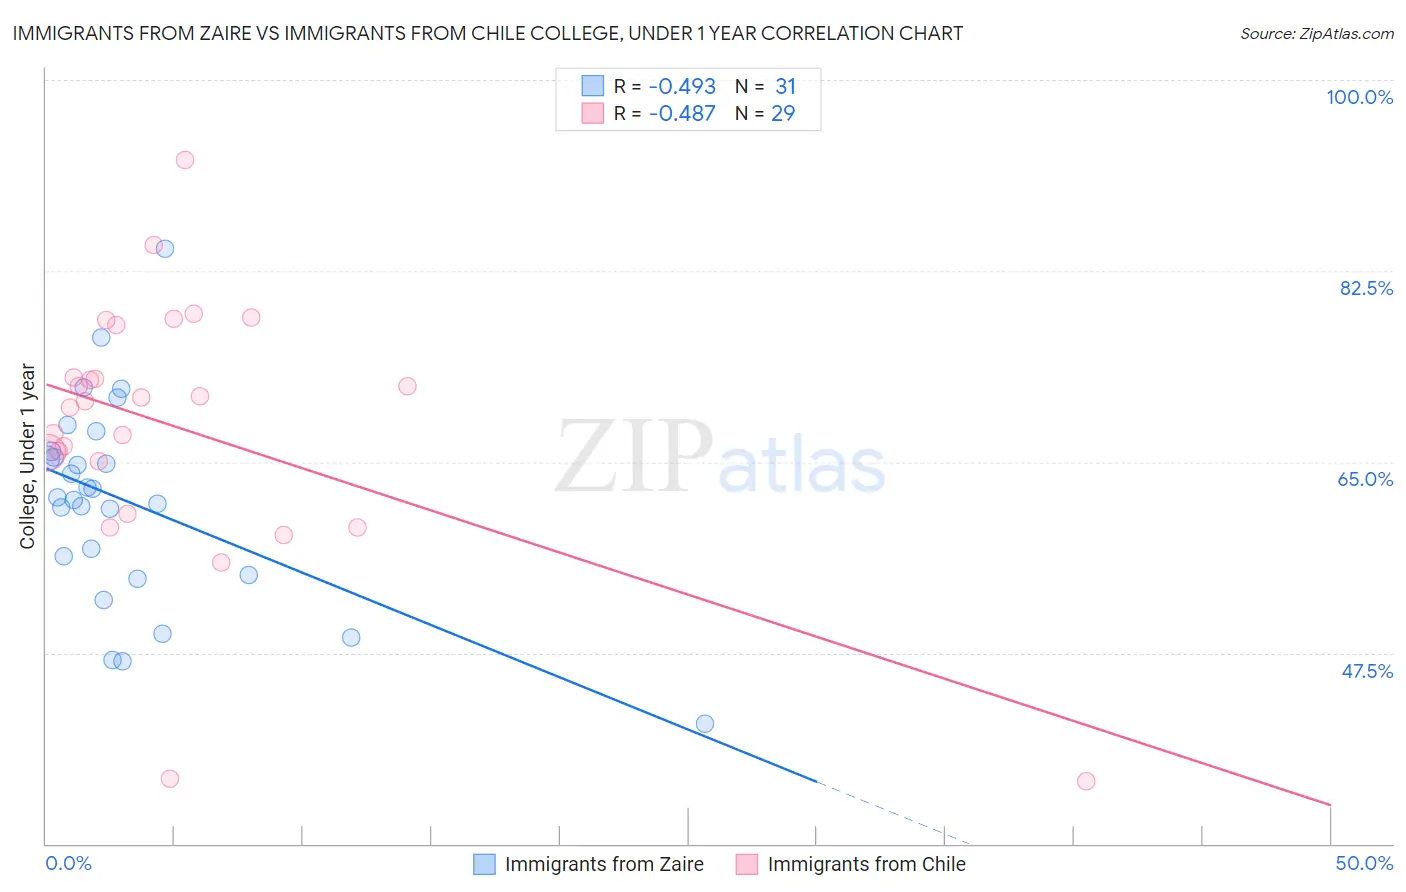
Immigrants from Zaire vs Immigrants from Chile College, Under 1 year Correlation Chart
The statistical analysis conducted on geographies consisting of 107,255,700 people shows a moderate negative correlation between the proportion of Immigrants from Zaire and percentage of population with at least college, under 1 year education in the United States with a correlation coefficient (R) of -0.493 and weighted average of 64.1%. Similarly, the statistical analysis conducted on geographies consisting of 218,647,266 people shows a moderate negative correlation between the proportion of Immigrants from Chile and percentage of population with at least college, under 1 year education in the United States with a correlation coefficient (R) of -0.487 and weighted average of 66.8%, a difference of 4.2%.
College, Under 1 year Correlation Summary
| Measurement | Immigrants from Zaire | Immigrants from Chile |
| Minimum | 41.0% | 35.7% |
| Maximum | 84.6% | 92.6% |
| Range | 43.5% | 56.9% |
| Mean | 61.3% | 68.1% |
| Median | 61.7% | 70.6% |
| Interquartile 25% (IQ1) | 54.7% | 62.6% |
| Interquartile 75% (IQ3) | 66.0% | 75.1% |
| Interquartile Range (IQR) | 11.3% | 12.5% |
| Standard Deviation (Sample) | 9.3% | 12.1% |
| Standard Deviation (Population) | 9.2% | 11.9% |
Similar Demographics by College, Under 1 year
Demographics Similar to Immigrants from Zaire by College, Under 1 year
In terms of college, under 1 year, the demographic groups most similar to Immigrants from Zaire are Peruvian (64.1%, a difference of 0.080%), Uruguayan (64.2%, a difference of 0.090%), French Canadian (64.2%, a difference of 0.14%), South American (64.2%, a difference of 0.14%), and White/Caucasian (64.0%, a difference of 0.17%).
| Demographics | Rating | Rank | College, Under 1 year |
| Costa Ricans | 19.6 /100 | #197 | Poor 64.4% |
| Tsimshian | 17.9 /100 | #198 | Poor 64.3% |
| Panamanians | 17.0 /100 | #199 | Poor 64.3% |
| Nigerians | 16.7 /100 | #200 | Poor 64.3% |
| French Canadians | 16.3 /100 | #201 | Poor 64.2% |
| South Americans | 16.2 /100 | #202 | Poor 64.2% |
| Uruguayans | 15.6 /100 | #203 | Poor 64.2% |
| Immigrants | Zaire | 14.6 /100 | #204 | Poor 64.1% |
| Peruvians | 13.7 /100 | #205 | Poor 64.1% |
| Whites/Caucasians | 12.8 /100 | #206 | Poor 64.0% |
| Colombians | 12.4 /100 | #207 | Poor 64.0% |
| Immigrants | Vietnam | 12.1 /100 | #208 | Poor 64.0% |
| Puget Sound Salish | 11.3 /100 | #209 | Poor 63.9% |
| Ghanaians | 11.2 /100 | #210 | Poor 63.9% |
| Native Hawaiians | 10.6 /100 | #211 | Poor 63.9% |
Demographics Similar to Immigrants from Chile by College, Under 1 year
In terms of college, under 1 year, the demographic groups most similar to Immigrants from Chile are Ugandan (66.8%, a difference of 0.040%), Canadian (66.8%, a difference of 0.050%), Immigrants from Italy (66.8%, a difference of 0.050%), Iraqi (66.8%, a difference of 0.060%), and Immigrants from Brazil (66.9%, a difference of 0.090%).
| Demographics | Rating | Rank | College, Under 1 year |
| Immigrants | Syria | 89.0 /100 | #130 | Excellent 66.9% |
| Finns | 88.6 /100 | #131 | Excellent 66.9% |
| Poles | 88.4 /100 | #132 | Excellent 66.9% |
| Immigrants | Brazil | 88.3 /100 | #133 | Excellent 66.9% |
| Iraqis | 88.0 /100 | #134 | Excellent 66.8% |
| Canadians | 87.9 /100 | #135 | Excellent 66.8% |
| Ugandans | 87.8 /100 | #136 | Excellent 66.8% |
| Immigrants | Chile | 87.4 /100 | #137 | Excellent 66.8% |
| Immigrants | Italy | 86.9 /100 | #138 | Excellent 66.8% |
| Venezuelans | 85.9 /100 | #139 | Excellent 66.7% |
| Slavs | 85.9 /100 | #140 | Excellent 66.7% |
| Immigrants | Afghanistan | 85.1 /100 | #141 | Excellent 66.7% |
| English | 82.9 /100 | #142 | Excellent 66.6% |
| Immigrants | Uganda | 82.8 /100 | #143 | Excellent 66.5% |
| Immigrants | Germany | 82.0 /100 | #144 | Excellent 66.5% |