Immigrants from Latin America vs Immigrants from Denmark College, Under 1 year
COMPARE
Immigrants from Latin America
Immigrants from Denmark
College, Under 1 year
College, Under 1 year Comparison
Immigrants from Latin America
Immigrants from Denmark
56.3%
COLLEGE, UNDER 1 YEAR
0.0/ 100
METRIC RATING
325th/ 347
METRIC RANK
71.0%
COLLEGE, UNDER 1 YEAR
100.0/ 100
METRIC RATING
26th/ 347
METRIC RANK
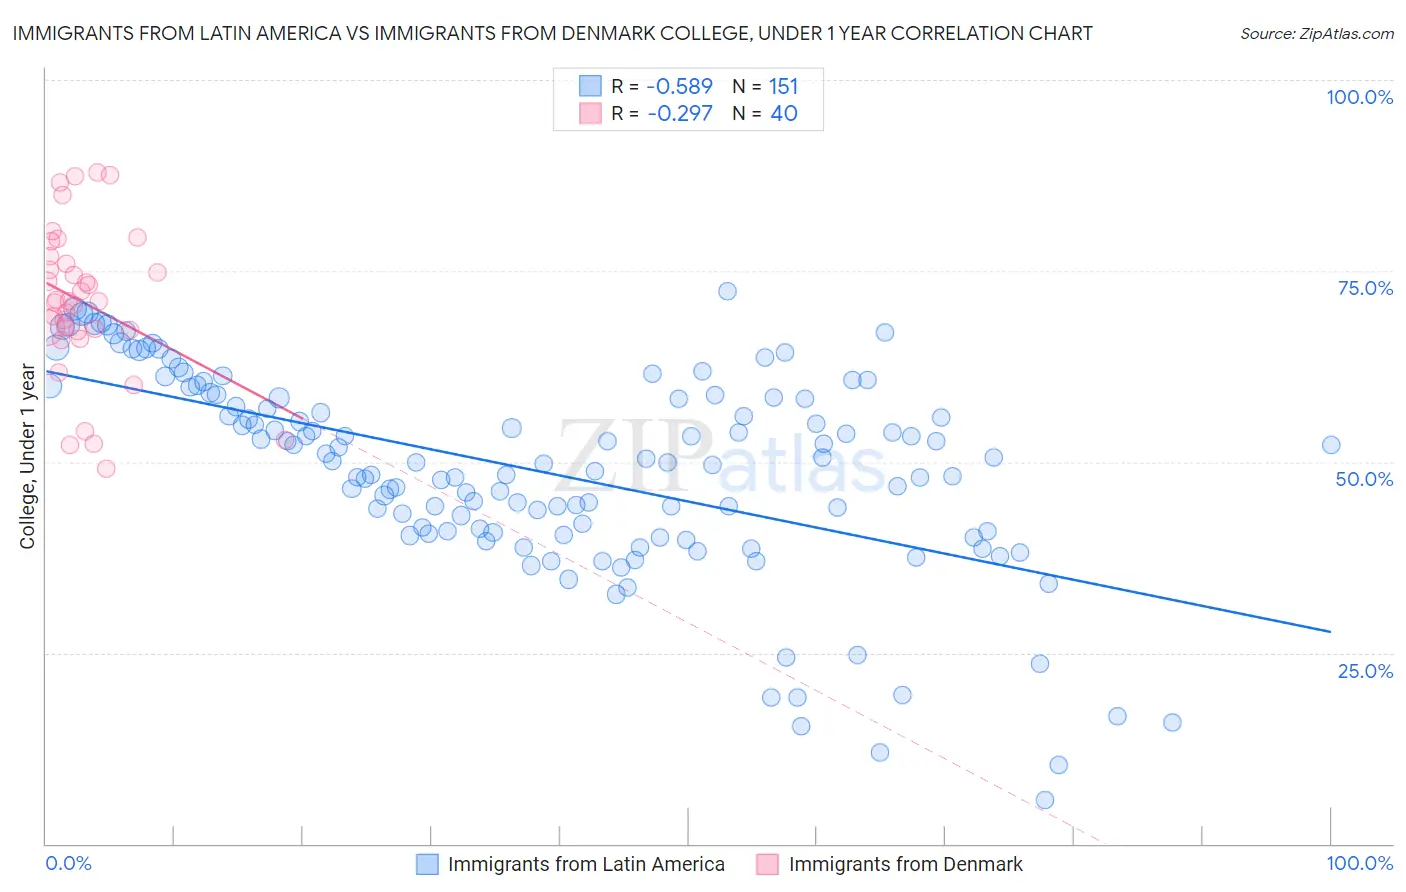
Immigrants from Latin America vs Immigrants from Denmark College, Under 1 year Correlation Chart
The statistical analysis conducted on geographies consisting of 558,640,127 people shows a substantial negative correlation between the proportion of Immigrants from Latin America and percentage of population with at least college, under 1 year education in the United States with a correlation coefficient (R) of -0.589 and weighted average of 56.3%. Similarly, the statistical analysis conducted on geographies consisting of 136,430,833 people shows a weak negative correlation between the proportion of Immigrants from Denmark and percentage of population with at least college, under 1 year education in the United States with a correlation coefficient (R) of -0.297 and weighted average of 71.0%, a difference of 26.0%.
College, Under 1 year Correlation Summary
| Measurement | Immigrants from Latin America | Immigrants from Denmark |
| Minimum | 5.7% | 49.1% |
| Maximum | 72.4% | 87.9% |
| Range | 66.6% | 38.7% |
| Mean | 48.7% | 70.9% |
| Median | 50.0% | 71.0% |
| Interquartile 25% (IQ1) | 40.7% | 67.2% |
| Interquartile 75% (IQ3) | 58.5% | 76.4% |
| Interquartile Range (IQR) | 17.7% | 9.2% |
| Standard Deviation (Sample) | 13.4% | 9.9% |
| Standard Deviation (Population) | 13.3% | 9.8% |
Similar Demographics by College, Under 1 year
Demographics Similar to Immigrants from Latin America by College, Under 1 year
In terms of college, under 1 year, the demographic groups most similar to Immigrants from Latin America are Immigrants from El Salvador (56.4%, a difference of 0.10%), Navajo (56.3%, a difference of 0.15%), Immigrants from Honduras (56.5%, a difference of 0.23%), Immigrants from Guatemala (56.2%, a difference of 0.24%), and Immigrants from Caribbean (56.6%, a difference of 0.41%).
| Demographics | Rating | Rank | College, Under 1 year |
| Immigrants | Haiti | 0.0 /100 | #318 | Tragic 56.9% |
| Puerto Ricans | 0.0 /100 | #319 | Tragic 56.8% |
| Guatemalans | 0.0 /100 | #320 | Tragic 56.8% |
| Natives/Alaskans | 0.0 /100 | #321 | Tragic 56.6% |
| Immigrants | Caribbean | 0.0 /100 | #322 | Tragic 56.6% |
| Immigrants | Honduras | 0.0 /100 | #323 | Tragic 56.5% |
| Immigrants | El Salvador | 0.0 /100 | #324 | Tragic 56.4% |
| Immigrants | Latin America | 0.0 /100 | #325 | Tragic 56.3% |
| Navajo | 0.0 /100 | #326 | Tragic 56.3% |
| Immigrants | Guatemala | 0.0 /100 | #327 | Tragic 56.2% |
| Cape Verdeans | 0.0 /100 | #328 | Tragic 56.0% |
| Immigrants | Cuba | 0.0 /100 | #329 | Tragic 55.7% |
| Mexicans | 0.0 /100 | #330 | Tragic 55.6% |
| Dominicans | 0.0 /100 | #331 | Tragic 55.5% |
| Immigrants | Yemen | 0.0 /100 | #332 | Tragic 55.3% |
Demographics Similar to Immigrants from Denmark by College, Under 1 year
In terms of college, under 1 year, the demographic groups most similar to Immigrants from Denmark are Immigrants from Ireland (71.0%, a difference of 0.010%), Immigrants from Hong Kong (71.0%, a difference of 0.030%), Immigrants from France (71.0%, a difference of 0.040%), Bulgarian (71.1%, a difference of 0.12%), and Soviet Union (71.1%, a difference of 0.13%).
| Demographics | Rating | Rank | College, Under 1 year |
| Latvians | 100.0 /100 | #19 | Exceptional 71.6% |
| Immigrants | Korea | 100.0 /100 | #20 | Exceptional 71.6% |
| Immigrants | Belgium | 100.0 /100 | #21 | Exceptional 71.5% |
| Immigrants | Eastern Asia | 100.0 /100 | #22 | Exceptional 71.3% |
| Immigrants | Northern Europe | 100.0 /100 | #23 | Exceptional 71.1% |
| Soviet Union | 100.0 /100 | #24 | Exceptional 71.1% |
| Bulgarians | 100.0 /100 | #25 | Exceptional 71.1% |
| Immigrants | Denmark | 100.0 /100 | #26 | Exceptional 71.0% |
| Immigrants | Ireland | 100.0 /100 | #27 | Exceptional 71.0% |
| Immigrants | Hong Kong | 100.0 /100 | #28 | Exceptional 71.0% |
| Immigrants | France | 100.0 /100 | #29 | Exceptional 71.0% |
| Immigrants | China | 99.9 /100 | #30 | Exceptional 70.9% |
| Indians (Asian) | 99.9 /100 | #31 | Exceptional 70.8% |
| Turks | 99.9 /100 | #32 | Exceptional 70.7% |
| Immigrants | South Africa | 99.9 /100 | #33 | Exceptional 70.6% |