Immigrants from Western Africa vs Immigrants from Chile College, Under 1 year
COMPARE
Immigrants from Western Africa
Immigrants from Chile
College, Under 1 year
College, Under 1 year Comparison
Immigrants from Western Africa
Immigrants from Chile
62.8%
COLLEGE, UNDER 1 YEAR
2.4/ 100
METRIC RATING
231st/ 347
METRIC RANK
66.8%
COLLEGE, UNDER 1 YEAR
87.4/ 100
METRIC RATING
137th/ 347
METRIC RANK
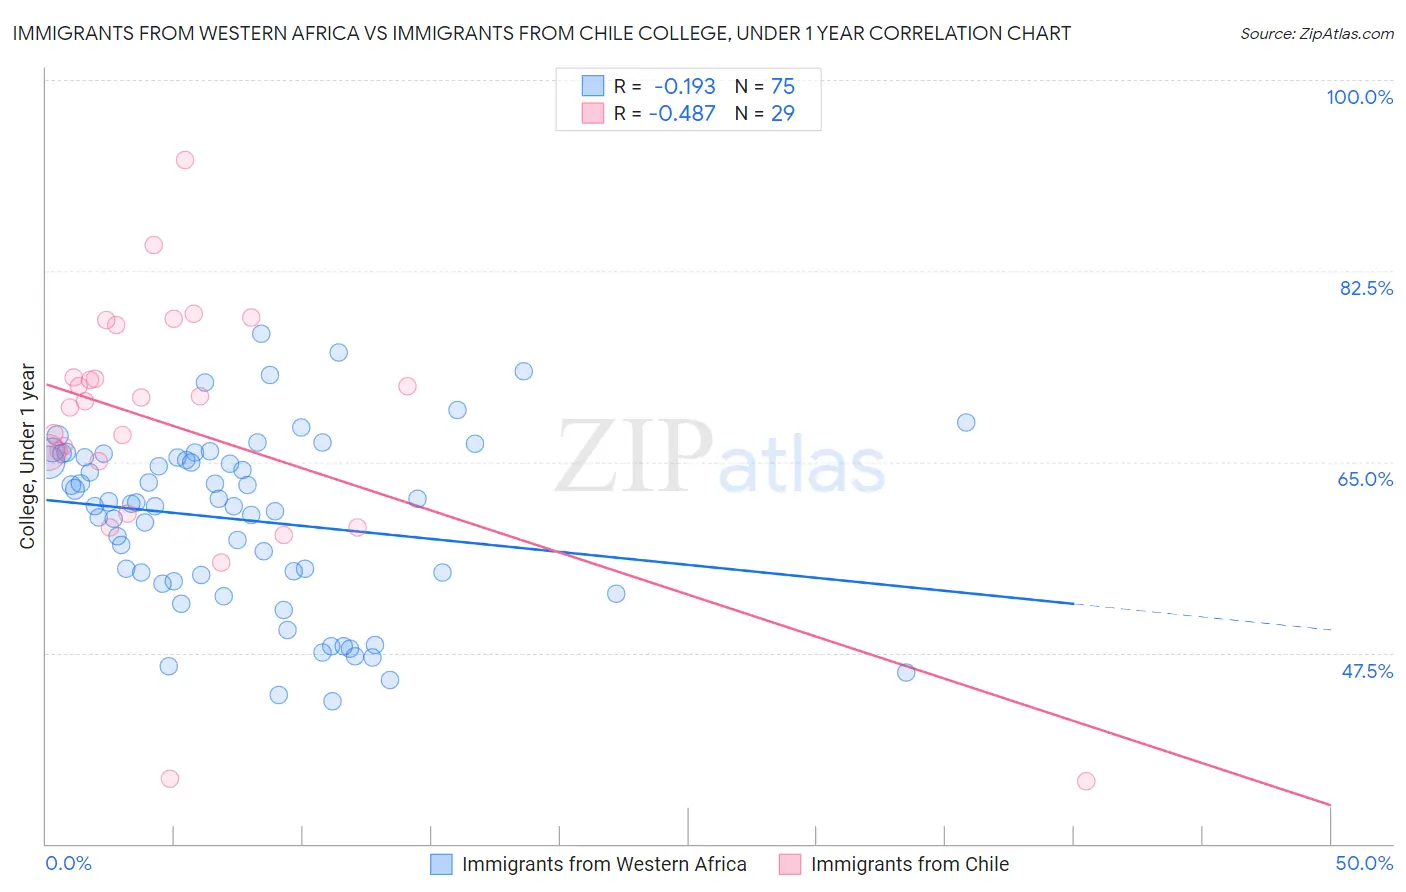
Immigrants from Western Africa vs Immigrants from Chile College, Under 1 year Correlation Chart
The statistical analysis conducted on geographies consisting of 357,885,062 people shows a poor negative correlation between the proportion of Immigrants from Western Africa and percentage of population with at least college, under 1 year education in the United States with a correlation coefficient (R) of -0.193 and weighted average of 62.8%. Similarly, the statistical analysis conducted on geographies consisting of 218,647,266 people shows a moderate negative correlation between the proportion of Immigrants from Chile and percentage of population with at least college, under 1 year education in the United States with a correlation coefficient (R) of -0.487 and weighted average of 66.8%, a difference of 6.5%.
College, Under 1 year Correlation Summary
| Measurement | Immigrants from Western Africa | Immigrants from Chile |
| Minimum | 43.0% | 35.7% |
| Maximum | 76.7% | 92.6% |
| Range | 33.7% | 56.9% |
| Mean | 59.7% | 68.1% |
| Median | 61.2% | 70.6% |
| Interquartile 25% (IQ1) | 54.1% | 62.6% |
| Interquartile 75% (IQ3) | 65.4% | 75.1% |
| Interquartile Range (IQR) | 11.4% | 12.5% |
| Standard Deviation (Sample) | 8.0% | 12.1% |
| Standard Deviation (Population) | 7.9% | 11.9% |
Similar Demographics by College, Under 1 year
Demographics Similar to Immigrants from Western Africa by College, Under 1 year
In terms of college, under 1 year, the demographic groups most similar to Immigrants from Western Africa are Osage (62.7%, a difference of 0.11%), Iroquois (62.6%, a difference of 0.22%), Nonimmigrants (62.9%, a difference of 0.24%), Chippewa (62.6%, a difference of 0.26%), and Liberian (63.0%, a difference of 0.31%).
| Demographics | Rating | Rank | College, Under 1 year |
| Sub-Saharan Africans | 4.4 /100 | #224 | Tragic 63.2% |
| Immigrants | Peru | 4.0 /100 | #225 | Tragic 63.1% |
| Immigrants | Colombia | 4.0 /100 | #226 | Tragic 63.1% |
| Immigrants | Ghana | 3.7 /100 | #227 | Tragic 63.1% |
| Samoans | 3.3 /100 | #228 | Tragic 63.0% |
| Liberians | 3.2 /100 | #229 | Tragic 63.0% |
| Immigrants | Nonimmigrants | 3.0 /100 | #230 | Tragic 62.9% |
| Immigrants | Western Africa | 2.4 /100 | #231 | Tragic 62.8% |
| Osage | 2.2 /100 | #232 | Tragic 62.7% |
| Iroquois | 2.0 /100 | #233 | Tragic 62.6% |
| Chippewa | 2.0 /100 | #234 | Tragic 62.6% |
| Spanish Americans | 1.9 /100 | #235 | Tragic 62.6% |
| Immigrants | Immigrants | 1.7 /100 | #236 | Tragic 62.5% |
| Immigrants | Burma/Myanmar | 1.6 /100 | #237 | Tragic 62.5% |
| French American Indians | 1.5 /100 | #238 | Tragic 62.4% |
Demographics Similar to Immigrants from Chile by College, Under 1 year
In terms of college, under 1 year, the demographic groups most similar to Immigrants from Chile are Ugandan (66.8%, a difference of 0.040%), Canadian (66.8%, a difference of 0.050%), Immigrants from Italy (66.8%, a difference of 0.050%), Iraqi (66.8%, a difference of 0.060%), and Immigrants from Brazil (66.9%, a difference of 0.090%).
| Demographics | Rating | Rank | College, Under 1 year |
| Immigrants | Syria | 89.0 /100 | #130 | Excellent 66.9% |
| Finns | 88.6 /100 | #131 | Excellent 66.9% |
| Poles | 88.4 /100 | #132 | Excellent 66.9% |
| Immigrants | Brazil | 88.3 /100 | #133 | Excellent 66.9% |
| Iraqis | 88.0 /100 | #134 | Excellent 66.8% |
| Canadians | 87.9 /100 | #135 | Excellent 66.8% |
| Ugandans | 87.8 /100 | #136 | Excellent 66.8% |
| Immigrants | Chile | 87.4 /100 | #137 | Excellent 66.8% |
| Immigrants | Italy | 86.9 /100 | #138 | Excellent 66.8% |
| Venezuelans | 85.9 /100 | #139 | Excellent 66.7% |
| Slavs | 85.9 /100 | #140 | Excellent 66.7% |
| Immigrants | Afghanistan | 85.1 /100 | #141 | Excellent 66.7% |
| English | 82.9 /100 | #142 | Excellent 66.6% |
| Immigrants | Uganda | 82.8 /100 | #143 | Excellent 66.5% |
| Immigrants | Germany | 82.0 /100 | #144 | Excellent 66.5% |