Immigrants from Japan vs Immigrants from Chile College, Under 1 year
COMPARE
Immigrants from Japan
Immigrants from Chile
College, Under 1 year
College, Under 1 year Comparison
Immigrants from Japan
Immigrants from Chile
71.9%
COLLEGE, UNDER 1 YEAR
100.0/ 100
METRIC RATING
16th/ 347
METRIC RANK
66.8%
COLLEGE, UNDER 1 YEAR
87.4/ 100
METRIC RATING
137th/ 347
METRIC RANK
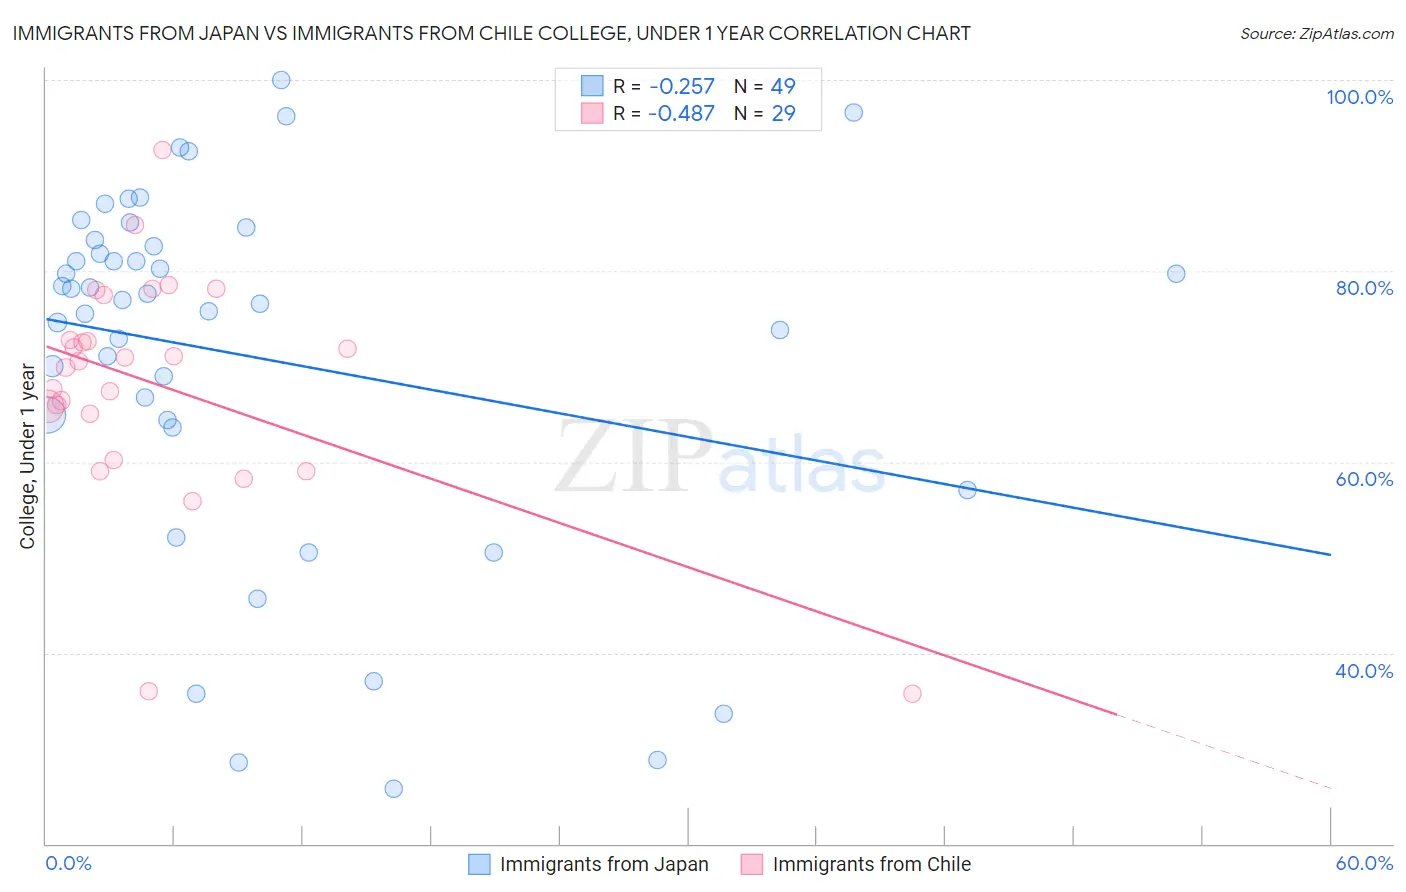
Immigrants from Japan vs Immigrants from Chile College, Under 1 year Correlation Chart
The statistical analysis conducted on geographies consisting of 340,148,871 people shows a weak negative correlation between the proportion of Immigrants from Japan and percentage of population with at least college, under 1 year education in the United States with a correlation coefficient (R) of -0.257 and weighted average of 71.9%. Similarly, the statistical analysis conducted on geographies consisting of 218,647,266 people shows a moderate negative correlation between the proportion of Immigrants from Chile and percentage of population with at least college, under 1 year education in the United States with a correlation coefficient (R) of -0.487 and weighted average of 66.8%, a difference of 7.6%.
College, Under 1 year Correlation Summary
| Measurement | Immigrants from Japan | Immigrants from Chile |
| Minimum | 25.7% | 35.7% |
| Maximum | 100.0% | 92.6% |
| Range | 74.3% | 56.9% |
| Mean | 71.0% | 68.1% |
| Median | 76.9% | 70.6% |
| Interquartile 25% (IQ1) | 64.0% | 62.6% |
| Interquartile 75% (IQ3) | 82.9% | 75.1% |
| Interquartile Range (IQR) | 19.0% | 12.5% |
| Standard Deviation (Sample) | 19.0% | 12.1% |
| Standard Deviation (Population) | 18.8% | 11.9% |
Similar Demographics by College, Under 1 year
Demographics Similar to Immigrants from Japan by College, Under 1 year
In terms of college, under 1 year, the demographic groups most similar to Immigrants from Japan are Cambodian (71.9%, a difference of 0.010%), Burmese (71.9%, a difference of 0.010%), Cypriot (72.0%, a difference of 0.13%), Eastern European (71.8%, a difference of 0.14%), and Immigrants from Switzerland (71.7%, a difference of 0.28%).
| Demographics | Rating | Rank | College, Under 1 year |
| Immigrants | Australia | 100.0 /100 | #9 | Exceptional 72.7% |
| Immigrants | Israel | 100.0 /100 | #10 | Exceptional 72.3% |
| Immigrants | South Central Asia | 100.0 /100 | #11 | Exceptional 72.1% |
| Immigrants | Sweden | 100.0 /100 | #12 | Exceptional 72.1% |
| Cypriots | 100.0 /100 | #13 | Exceptional 72.0% |
| Cambodians | 100.0 /100 | #14 | Exceptional 71.9% |
| Burmese | 100.0 /100 | #15 | Exceptional 71.9% |
| Immigrants | Japan | 100.0 /100 | #16 | Exceptional 71.9% |
| Eastern Europeans | 100.0 /100 | #17 | Exceptional 71.8% |
| Immigrants | Switzerland | 100.0 /100 | #18 | Exceptional 71.7% |
| Latvians | 100.0 /100 | #19 | Exceptional 71.6% |
| Immigrants | Korea | 100.0 /100 | #20 | Exceptional 71.6% |
| Immigrants | Belgium | 100.0 /100 | #21 | Exceptional 71.5% |
| Immigrants | Eastern Asia | 100.0 /100 | #22 | Exceptional 71.3% |
| Immigrants | Northern Europe | 100.0 /100 | #23 | Exceptional 71.1% |
Demographics Similar to Immigrants from Chile by College, Under 1 year
In terms of college, under 1 year, the demographic groups most similar to Immigrants from Chile are Ugandan (66.8%, a difference of 0.040%), Canadian (66.8%, a difference of 0.050%), Immigrants from Italy (66.8%, a difference of 0.050%), Iraqi (66.8%, a difference of 0.060%), and Immigrants from Brazil (66.9%, a difference of 0.090%).
| Demographics | Rating | Rank | College, Under 1 year |
| Immigrants | Syria | 89.0 /100 | #130 | Excellent 66.9% |
| Finns | 88.6 /100 | #131 | Excellent 66.9% |
| Poles | 88.4 /100 | #132 | Excellent 66.9% |
| Immigrants | Brazil | 88.3 /100 | #133 | Excellent 66.9% |
| Iraqis | 88.0 /100 | #134 | Excellent 66.8% |
| Canadians | 87.9 /100 | #135 | Excellent 66.8% |
| Ugandans | 87.8 /100 | #136 | Excellent 66.8% |
| Immigrants | Chile | 87.4 /100 | #137 | Excellent 66.8% |
| Immigrants | Italy | 86.9 /100 | #138 | Excellent 66.8% |
| Venezuelans | 85.9 /100 | #139 | Excellent 66.7% |
| Slavs | 85.9 /100 | #140 | Excellent 66.7% |
| Immigrants | Afghanistan | 85.1 /100 | #141 | Excellent 66.7% |
| English | 82.9 /100 | #142 | Excellent 66.6% |
| Immigrants | Uganda | 82.8 /100 | #143 | Excellent 66.5% |
| Immigrants | Germany | 82.0 /100 | #144 | Excellent 66.5% |