Immigrants from Latin America vs Kiowa College, Under 1 year
COMPARE
Immigrants from Latin America
Kiowa
College, Under 1 year
College, Under 1 year Comparison
Immigrants from Latin America
Kiowa
56.3%
COLLEGE, UNDER 1 YEAR
0.0/ 100
METRIC RATING
325th/ 347
METRIC RANK
57.8%
COLLEGE, UNDER 1 YEAR
0.0/ 100
METRIC RATING
304th/ 347
METRIC RANK
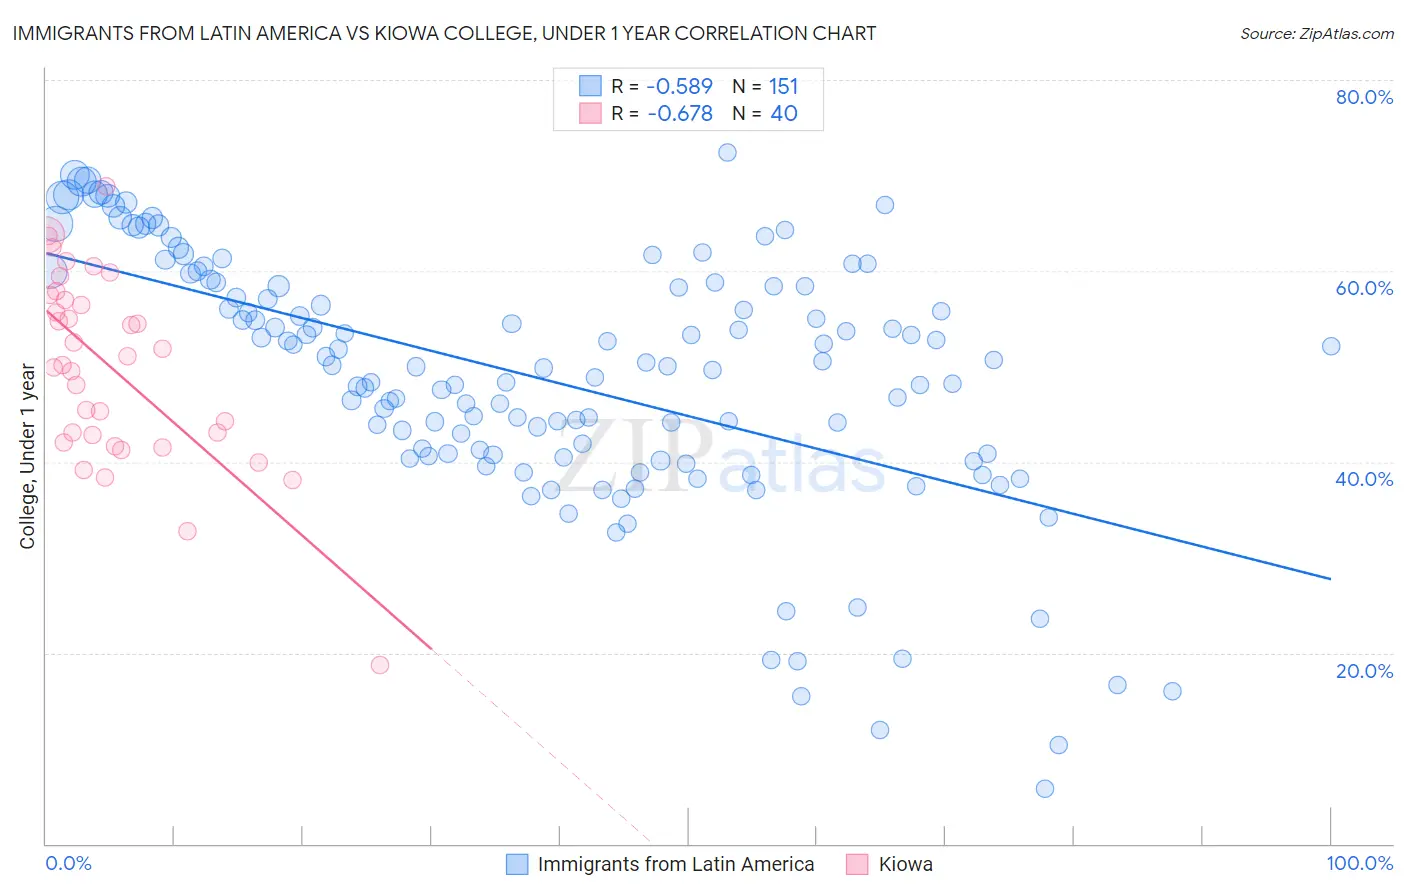
Immigrants from Latin America vs Kiowa College, Under 1 year Correlation Chart
The statistical analysis conducted on geographies consisting of 558,640,127 people shows a substantial negative correlation between the proportion of Immigrants from Latin America and percentage of population with at least college, under 1 year education in the United States with a correlation coefficient (R) of -0.589 and weighted average of 56.3%. Similarly, the statistical analysis conducted on geographies consisting of 56,101,444 people shows a significant negative correlation between the proportion of Kiowa and percentage of population with at least college, under 1 year education in the United States with a correlation coefficient (R) of -0.678 and weighted average of 57.8%, a difference of 2.7%.
College, Under 1 year Correlation Summary
| Measurement | Immigrants from Latin America | Kiowa |
| Minimum | 5.7% | 18.8% |
| Maximum | 72.4% | 68.9% |
| Range | 66.6% | 50.2% |
| Mean | 48.7% | 49.8% |
| Median | 50.0% | 50.6% |
| Interquartile 25% (IQ1) | 40.7% | 42.4% |
| Interquartile 75% (IQ3) | 58.5% | 57.2% |
| Interquartile Range (IQR) | 17.7% | 14.8% |
| Standard Deviation (Sample) | 13.4% | 10.0% |
| Standard Deviation (Population) | 13.3% | 9.9% |
Similar Demographics by College, Under 1 year
Demographics Similar to Immigrants from Latin America by College, Under 1 year
In terms of college, under 1 year, the demographic groups most similar to Immigrants from Latin America are Immigrants from El Salvador (56.4%, a difference of 0.10%), Navajo (56.3%, a difference of 0.15%), Immigrants from Honduras (56.5%, a difference of 0.23%), Immigrants from Guatemala (56.2%, a difference of 0.24%), and Immigrants from Caribbean (56.6%, a difference of 0.41%).
| Demographics | Rating | Rank | College, Under 1 year |
| Immigrants | Haiti | 0.0 /100 | #318 | Tragic 56.9% |
| Puerto Ricans | 0.0 /100 | #319 | Tragic 56.8% |
| Guatemalans | 0.0 /100 | #320 | Tragic 56.8% |
| Natives/Alaskans | 0.0 /100 | #321 | Tragic 56.6% |
| Immigrants | Caribbean | 0.0 /100 | #322 | Tragic 56.6% |
| Immigrants | Honduras | 0.0 /100 | #323 | Tragic 56.5% |
| Immigrants | El Salvador | 0.0 /100 | #324 | Tragic 56.4% |
| Immigrants | Latin America | 0.0 /100 | #325 | Tragic 56.3% |
| Navajo | 0.0 /100 | #326 | Tragic 56.3% |
| Immigrants | Guatemala | 0.0 /100 | #327 | Tragic 56.2% |
| Cape Verdeans | 0.0 /100 | #328 | Tragic 56.0% |
| Immigrants | Cuba | 0.0 /100 | #329 | Tragic 55.7% |
| Mexicans | 0.0 /100 | #330 | Tragic 55.6% |
| Dominicans | 0.0 /100 | #331 | Tragic 55.5% |
| Immigrants | Yemen | 0.0 /100 | #332 | Tragic 55.3% |
Demographics Similar to Kiowa by College, Under 1 year
In terms of college, under 1 year, the demographic groups most similar to Kiowa are Immigrants from Dominica (57.9%, a difference of 0.010%), Haitian (57.8%, a difference of 0.11%), Apache (58.0%, a difference of 0.30%), Immigrants from Portugal (57.7%, a difference of 0.31%), and Fijian (57.7%, a difference of 0.32%).
| Demographics | Rating | Rank | College, Under 1 year |
| Guyanese | 0.0 /100 | #297 | Tragic 59.0% |
| Immigrants | Ecuador | 0.0 /100 | #298 | Tragic 58.7% |
| Cubans | 0.0 /100 | #299 | Tragic 58.6% |
| Immigrants | Guyana | 0.0 /100 | #300 | Tragic 58.5% |
| Mexican American Indians | 0.0 /100 | #301 | Tragic 58.1% |
| Apache | 0.0 /100 | #302 | Tragic 58.0% |
| Immigrants | Dominica | 0.0 /100 | #303 | Tragic 57.9% |
| Kiowa | 0.0 /100 | #304 | Tragic 57.8% |
| Haitians | 0.0 /100 | #305 | Tragic 57.8% |
| Immigrants | Portugal | 0.0 /100 | #306 | Tragic 57.7% |
| Fijians | 0.0 /100 | #307 | Tragic 57.7% |
| Central Americans | 0.0 /100 | #308 | Tragic 57.7% |
| Immigrants | Nicaragua | 0.0 /100 | #309 | Tragic 57.6% |
| Pueblo | 0.0 /100 | #310 | Tragic 57.4% |
| Cajuns | 0.0 /100 | #311 | Tragic 57.3% |