Immigrants from Laos vs Immigrants from Costa Rica College, 1 year or more
COMPARE
Immigrants from Laos
Immigrants from Costa Rica
College, 1 year or more
College, 1 year or more Comparison
Immigrants from Laos
Immigrants from Costa Rica
54.7%
COLLEGE, 1 YEAR OR MORE
0.2/ 100
METRIC RATING
265th/ 347
METRIC RANK
57.5%
COLLEGE, 1 YEAR OR MORE
8.0/ 100
METRIC RATING
220th/ 347
METRIC RANK
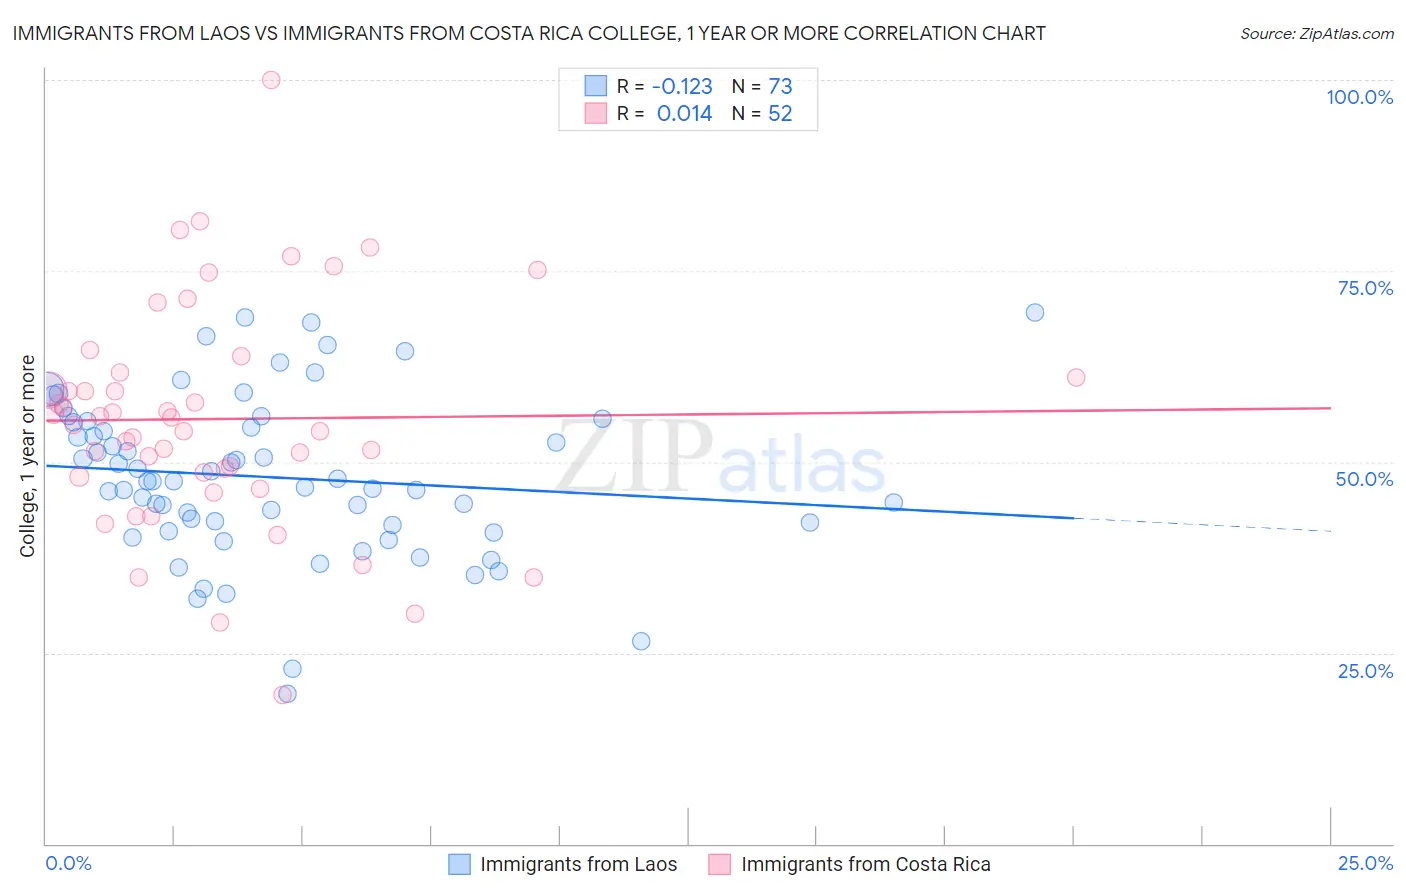
Immigrants from Laos vs Immigrants from Costa Rica College, 1 year or more Correlation Chart
The statistical analysis conducted on geographies consisting of 201,475,535 people shows a poor negative correlation between the proportion of Immigrants from Laos and percentage of population with at least college, 1 year or more education in the United States with a correlation coefficient (R) of -0.123 and weighted average of 54.7%. Similarly, the statistical analysis conducted on geographies consisting of 204,277,408 people shows no correlation between the proportion of Immigrants from Costa Rica and percentage of population with at least college, 1 year or more education in the United States with a correlation coefficient (R) of 0.014 and weighted average of 57.5%, a difference of 5.1%.
College, 1 year or more Correlation Summary
| Measurement | Immigrants from Laos | Immigrants from Costa Rica |
| Minimum | 19.6% | 19.5% |
| Maximum | 69.6% | 100.0% |
| Range | 49.9% | 80.5% |
| Mean | 48.0% | 55.6% |
| Median | 47.5% | 55.4% |
| Interquartile 25% (IQ1) | 41.3% | 48.3% |
| Interquartile 75% (IQ3) | 55.2% | 61.4% |
| Interquartile Range (IQR) | 13.9% | 13.0% |
| Standard Deviation (Sample) | 10.5% | 14.8% |
| Standard Deviation (Population) | 10.4% | 14.7% |
Similar Demographics by College, 1 year or more
Demographics Similar to Immigrants from Laos by College, 1 year or more
In terms of college, 1 year or more, the demographic groups most similar to Immigrants from Laos are Potawatomi (54.6%, a difference of 0.050%), Blackfeet (54.6%, a difference of 0.12%), Immigrants from Micronesia (54.8%, a difference of 0.19%), U.S. Virgin Islander (54.8%, a difference of 0.22%), and Immigrants from St. Vincent and the Grenadines (54.8%, a difference of 0.24%).
| Demographics | Rating | Rank | College, 1 year or more |
| Africans | 0.4 /100 | #258 | Tragic 55.0% |
| Nepalese | 0.3 /100 | #259 | Tragic 54.9% |
| Jamaicans | 0.3 /100 | #260 | Tragic 54.9% |
| Ottawa | 0.3 /100 | #261 | Tragic 54.9% |
| Immigrants | St. Vincent and the Grenadines | 0.3 /100 | #262 | Tragic 54.8% |
| U.S. Virgin Islanders | 0.3 /100 | #263 | Tragic 54.8% |
| Immigrants | Micronesia | 0.3 /100 | #264 | Tragic 54.8% |
| Immigrants | Laos | 0.2 /100 | #265 | Tragic 54.7% |
| Potawatomi | 0.2 /100 | #266 | Tragic 54.6% |
| Blackfeet | 0.2 /100 | #267 | Tragic 54.6% |
| British West Indians | 0.2 /100 | #268 | Tragic 54.5% |
| Bangladeshis | 0.2 /100 | #269 | Tragic 54.5% |
| Crow | 0.2 /100 | #270 | Tragic 54.5% |
| Bahamians | 0.2 /100 | #271 | Tragic 54.5% |
| Comanche | 0.2 /100 | #272 | Tragic 54.4% |
Demographics Similar to Immigrants from Costa Rica by College, 1 year or more
In terms of college, 1 year or more, the demographic groups most similar to Immigrants from Costa Rica are Immigrants from Ghana (57.4%, a difference of 0.070%), White/Caucasian (57.6%, a difference of 0.12%), Native Hawaiian (57.6%, a difference of 0.18%), Immigrants from Panama (57.6%, a difference of 0.19%), and Subsaharan African (57.3%, a difference of 0.41%).
| Demographics | Rating | Rank | College, 1 year or more |
| French Canadians | 11.8 /100 | #213 | Poor 57.8% |
| Immigrants | Colombia | 11.6 /100 | #214 | Poor 57.8% |
| Tongans | 11.6 /100 | #215 | Poor 57.8% |
| Immigrants | Peru | 10.6 /100 | #216 | Poor 57.7% |
| Immigrants | Panama | 9.1 /100 | #217 | Tragic 57.6% |
| Native Hawaiians | 9.0 /100 | #218 | Tragic 57.6% |
| Whites/Caucasians | 8.7 /100 | #219 | Tragic 57.6% |
| Immigrants | Costa Rica | 8.0 /100 | #220 | Tragic 57.5% |
| Immigrants | Ghana | 7.7 /100 | #221 | Tragic 57.4% |
| Sub-Saharan Africans | 6.1 /100 | #222 | Tragic 57.3% |
| Portuguese | 5.4 /100 | #223 | Tragic 57.2% |
| Hmong | 5.4 /100 | #224 | Tragic 57.2% |
| Vietnamese | 4.7 /100 | #225 | Tragic 57.0% |
| Immigrants | Western Africa | 4.6 /100 | #226 | Tragic 57.0% |
| Immigrants | Immigrants | 4.4 /100 | #227 | Tragic 57.0% |