Cape Verdean vs Ute College, 1 year or more
COMPARE
Cape Verdean
Ute
College, 1 year or more
College, 1 year or more Comparison
Cape Verdeans
Ute
50.3%
COLLEGE, 1 YEAR OR MORE
0.0/ 100
METRIC RATING
329th/ 347
METRIC RANK
53.8%
COLLEGE, 1 YEAR OR MORE
0.1/ 100
METRIC RATING
284th/ 347
METRIC RANK
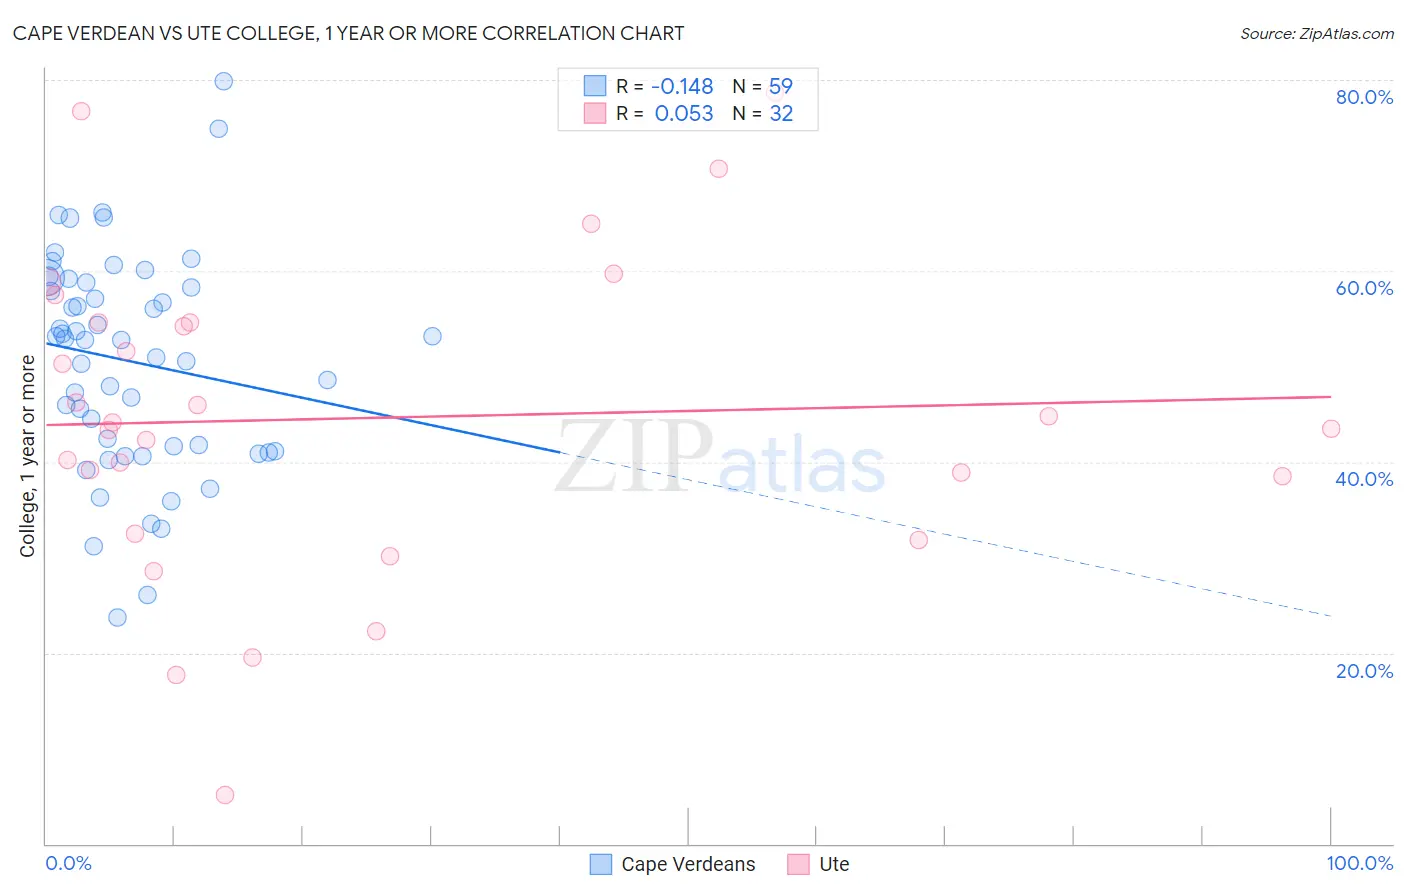
Cape Verdean vs Ute College, 1 year or more Correlation Chart
The statistical analysis conducted on geographies consisting of 107,580,652 people shows a poor negative correlation between the proportion of Cape Verdeans and percentage of population with at least college, 1 year or more education in the United States with a correlation coefficient (R) of -0.148 and weighted average of 50.3%. Similarly, the statistical analysis conducted on geographies consisting of 55,668,599 people shows a slight positive correlation between the proportion of Ute and percentage of population with at least college, 1 year or more education in the United States with a correlation coefficient (R) of 0.053 and weighted average of 53.8%, a difference of 6.9%.
College, 1 year or more Correlation Summary
| Measurement | Cape Verdean | Ute |
| Minimum | 23.7% | 5.1% |
| Maximum | 79.9% | 78.7% |
| Range | 56.2% | 73.6% |
| Mean | 50.6% | 44.6% |
| Median | 52.7% | 43.8% |
| Interquartile 25% (IQ1) | 41.1% | 35.4% |
| Interquartile 75% (IQ3) | 58.8% | 54.6% |
| Interquartile Range (IQR) | 17.7% | 19.2% |
| Standard Deviation (Sample) | 11.4% | 16.7% |
| Standard Deviation (Population) | 11.3% | 16.4% |
Similar Demographics by College, 1 year or more
Demographics Similar to Cape Verdeans by College, 1 year or more
In terms of college, 1 year or more, the demographic groups most similar to Cape Verdeans are Native/Alaskan (50.2%, a difference of 0.22%), Dutch West Indian (50.5%, a difference of 0.39%), Menominee (50.6%, a difference of 0.51%), Dominican (50.6%, a difference of 0.55%), and Immigrants from Yemen (50.0%, a difference of 0.57%).
| Demographics | Rating | Rank | College, 1 year or more |
| Navajo | 0.0 /100 | #322 | Tragic 50.8% |
| Immigrants | Guatemala | 0.0 /100 | #323 | Tragic 50.7% |
| Immigrants | Cuba | 0.0 /100 | #324 | Tragic 50.7% |
| Immigrants | Latin America | 0.0 /100 | #325 | Tragic 50.7% |
| Dominicans | 0.0 /100 | #326 | Tragic 50.6% |
| Menominee | 0.0 /100 | #327 | Tragic 50.6% |
| Dutch West Indians | 0.0 /100 | #328 | Tragic 50.5% |
| Cape Verdeans | 0.0 /100 | #329 | Tragic 50.3% |
| Natives/Alaskans | 0.0 /100 | #330 | Tragic 50.2% |
| Immigrants | Yemen | 0.0 /100 | #331 | Tragic 50.0% |
| Mexicans | 0.0 /100 | #332 | Tragic 49.2% |
| Immigrants | Dominican Republic | 0.0 /100 | #333 | Tragic 49.1% |
| Lumbee | 0.0 /100 | #334 | Tragic 48.9% |
| Yuman | 0.0 /100 | #335 | Tragic 48.7% |
| Spanish American Indians | 0.0 /100 | #336 | Tragic 48.5% |
Demographics Similar to Ute by College, 1 year or more
In terms of college, 1 year or more, the demographic groups most similar to Ute are Nicaraguan (53.9%, a difference of 0.17%), Immigrants from Guyana (53.5%, a difference of 0.46%), Central American Indian (53.5%, a difference of 0.51%), Guyanese (54.1%, a difference of 0.53%), and Immigrants from Belize (53.5%, a difference of 0.54%).
| Demographics | Rating | Rank | College, 1 year or more |
| Ecuadorians | 0.2 /100 | #277 | Tragic 54.3% |
| Immigrants | Jamaica | 0.1 /100 | #278 | Tragic 54.2% |
| Arapaho | 0.1 /100 | #279 | Tragic 54.1% |
| Cheyenne | 0.1 /100 | #280 | Tragic 54.1% |
| Colville | 0.1 /100 | #281 | Tragic 54.1% |
| Guyanese | 0.1 /100 | #282 | Tragic 54.1% |
| Nicaraguans | 0.1 /100 | #283 | Tragic 53.9% |
| Ute | 0.1 /100 | #284 | Tragic 53.8% |
| Immigrants | Guyana | 0.1 /100 | #285 | Tragic 53.5% |
| Central American Indians | 0.1 /100 | #286 | Tragic 53.5% |
| Immigrants | Belize | 0.1 /100 | #287 | Tragic 53.5% |
| Alaska Natives | 0.0 /100 | #288 | Tragic 53.4% |
| Immigrants | Ecuador | 0.0 /100 | #289 | Tragic 53.4% |
| Alaskan Athabascans | 0.0 /100 | #290 | Tragic 53.4% |
| Cubans | 0.0 /100 | #291 | Tragic 53.4% |