Honduran vs Ute College, 1 year or more
COMPARE
Honduran
Ute
College, 1 year or more
College, 1 year or more Comparison
Hondurans
Ute
51.6%
COLLEGE, 1 YEAR OR MORE
0.0/ 100
METRIC RATING
310th/ 347
METRIC RANK
53.8%
COLLEGE, 1 YEAR OR MORE
0.1/ 100
METRIC RATING
284th/ 347
METRIC RANK
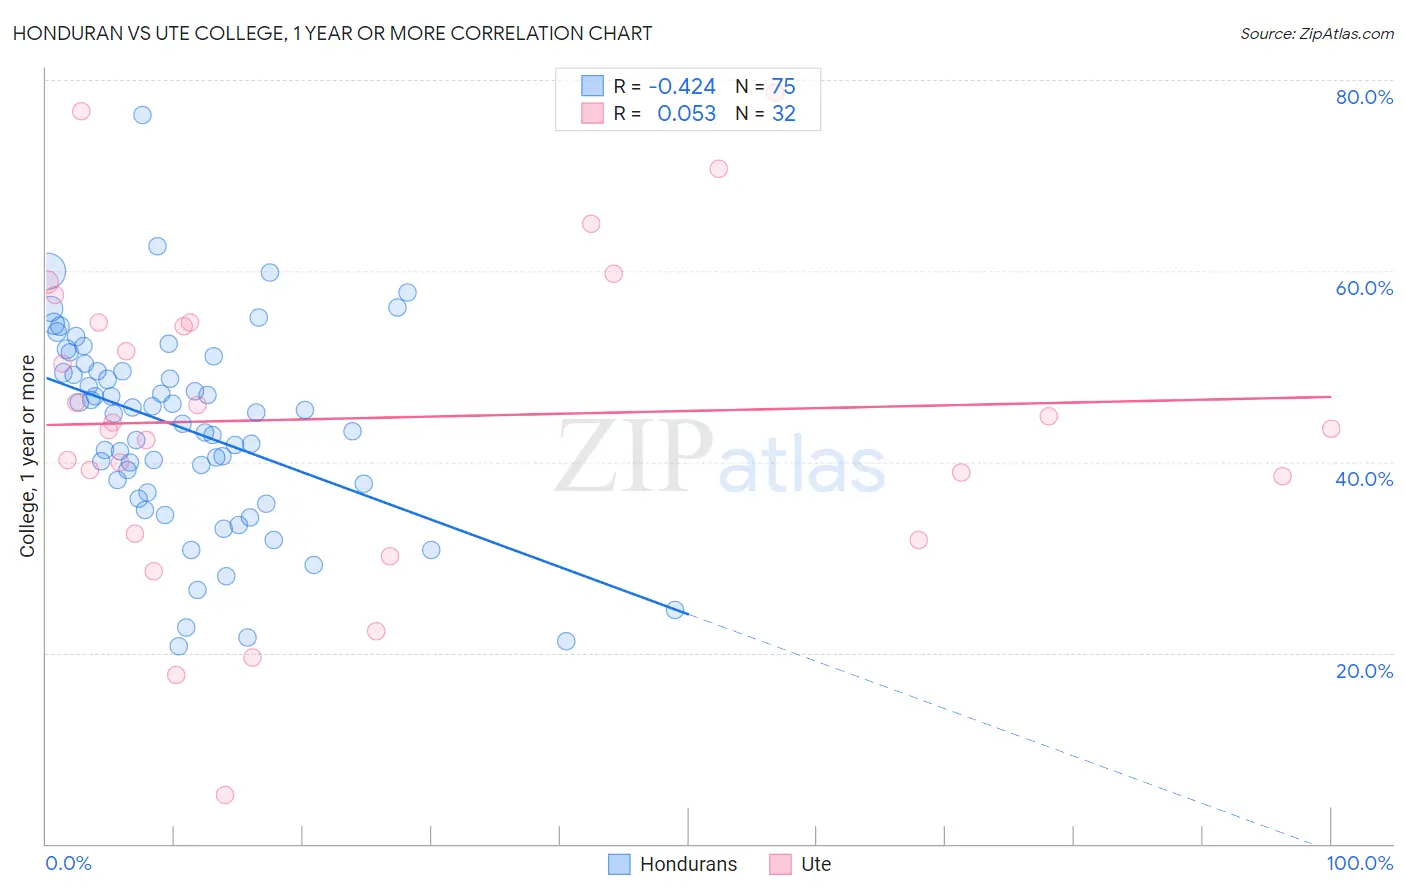
Honduran vs Ute College, 1 year or more Correlation Chart
The statistical analysis conducted on geographies consisting of 357,855,848 people shows a moderate negative correlation between the proportion of Hondurans and percentage of population with at least college, 1 year or more education in the United States with a correlation coefficient (R) of -0.424 and weighted average of 51.6%. Similarly, the statistical analysis conducted on geographies consisting of 55,668,599 people shows a slight positive correlation between the proportion of Ute and percentage of population with at least college, 1 year or more education in the United States with a correlation coefficient (R) of 0.053 and weighted average of 53.8%, a difference of 4.3%.
College, 1 year or more Correlation Summary
| Measurement | Honduran | Ute |
| Minimum | 20.7% | 5.1% |
| Maximum | 76.3% | 78.7% |
| Range | 55.6% | 73.6% |
| Mean | 43.4% | 44.6% |
| Median | 45.1% | 43.8% |
| Interquartile 25% (IQ1) | 36.7% | 35.4% |
| Interquartile 75% (IQ3) | 49.5% | 54.6% |
| Interquartile Range (IQR) | 12.8% | 19.2% |
| Standard Deviation (Sample) | 10.4% | 16.7% |
| Standard Deviation (Population) | 10.4% | 16.4% |
Similar Demographics by College, 1 year or more
Demographics Similar to Hondurans by College, 1 year or more
In terms of college, 1 year or more, the demographic groups most similar to Hondurans are Immigrants from Haiti (51.5%, a difference of 0.16%), Pueblo (51.5%, a difference of 0.20%), Immigrants from Caribbean (51.4%, a difference of 0.33%), Apache (51.8%, a difference of 0.39%), and Salvadoran (51.8%, a difference of 0.40%).
| Demographics | Rating | Rank | College, 1 year or more |
| Creek | 0.0 /100 | #303 | Tragic 52.2% |
| Central Americans | 0.0 /100 | #304 | Tragic 52.1% |
| Seminole | 0.0 /100 | #305 | Tragic 52.1% |
| Mexican American Indians | 0.0 /100 | #306 | Tragic 51.9% |
| Immigrants | Portugal | 0.0 /100 | #307 | Tragic 51.9% |
| Salvadorans | 0.0 /100 | #308 | Tragic 51.8% |
| Apache | 0.0 /100 | #309 | Tragic 51.8% |
| Hondurans | 0.0 /100 | #310 | Tragic 51.6% |
| Immigrants | Haiti | 0.0 /100 | #311 | Tragic 51.5% |
| Pueblo | 0.0 /100 | #312 | Tragic 51.5% |
| Immigrants | Caribbean | 0.0 /100 | #313 | Tragic 51.4% |
| Fijians | 0.0 /100 | #314 | Tragic 51.3% |
| Guatemalans | 0.0 /100 | #315 | Tragic 51.2% |
| Cajuns | 0.0 /100 | #316 | Tragic 51.2% |
| Hispanics or Latinos | 0.0 /100 | #317 | Tragic 51.1% |
Demographics Similar to Ute by College, 1 year or more
In terms of college, 1 year or more, the demographic groups most similar to Ute are Nicaraguan (53.9%, a difference of 0.17%), Immigrants from Guyana (53.5%, a difference of 0.46%), Central American Indian (53.5%, a difference of 0.51%), Guyanese (54.1%, a difference of 0.53%), and Immigrants from Belize (53.5%, a difference of 0.54%).
| Demographics | Rating | Rank | College, 1 year or more |
| Ecuadorians | 0.2 /100 | #277 | Tragic 54.3% |
| Immigrants | Jamaica | 0.1 /100 | #278 | Tragic 54.2% |
| Arapaho | 0.1 /100 | #279 | Tragic 54.1% |
| Cheyenne | 0.1 /100 | #280 | Tragic 54.1% |
| Colville | 0.1 /100 | #281 | Tragic 54.1% |
| Guyanese | 0.1 /100 | #282 | Tragic 54.1% |
| Nicaraguans | 0.1 /100 | #283 | Tragic 53.9% |
| Ute | 0.1 /100 | #284 | Tragic 53.8% |
| Immigrants | Guyana | 0.1 /100 | #285 | Tragic 53.5% |
| Central American Indians | 0.1 /100 | #286 | Tragic 53.5% |
| Immigrants | Belize | 0.1 /100 | #287 | Tragic 53.5% |
| Alaska Natives | 0.0 /100 | #288 | Tragic 53.4% |
| Immigrants | Ecuador | 0.0 /100 | #289 | Tragic 53.4% |
| Alaskan Athabascans | 0.0 /100 | #290 | Tragic 53.4% |
| Cubans | 0.0 /100 | #291 | Tragic 53.4% |