German Russian vs Ute College, 1 year or more
COMPARE
German Russian
Ute
College, 1 year or more
College, 1 year or more Comparison
German Russians
Ute
59.1%
COLLEGE, 1 YEAR OR MORE
39.3/ 100
METRIC RATING
183rd/ 347
METRIC RANK
53.8%
COLLEGE, 1 YEAR OR MORE
0.1/ 100
METRIC RATING
284th/ 347
METRIC RANK
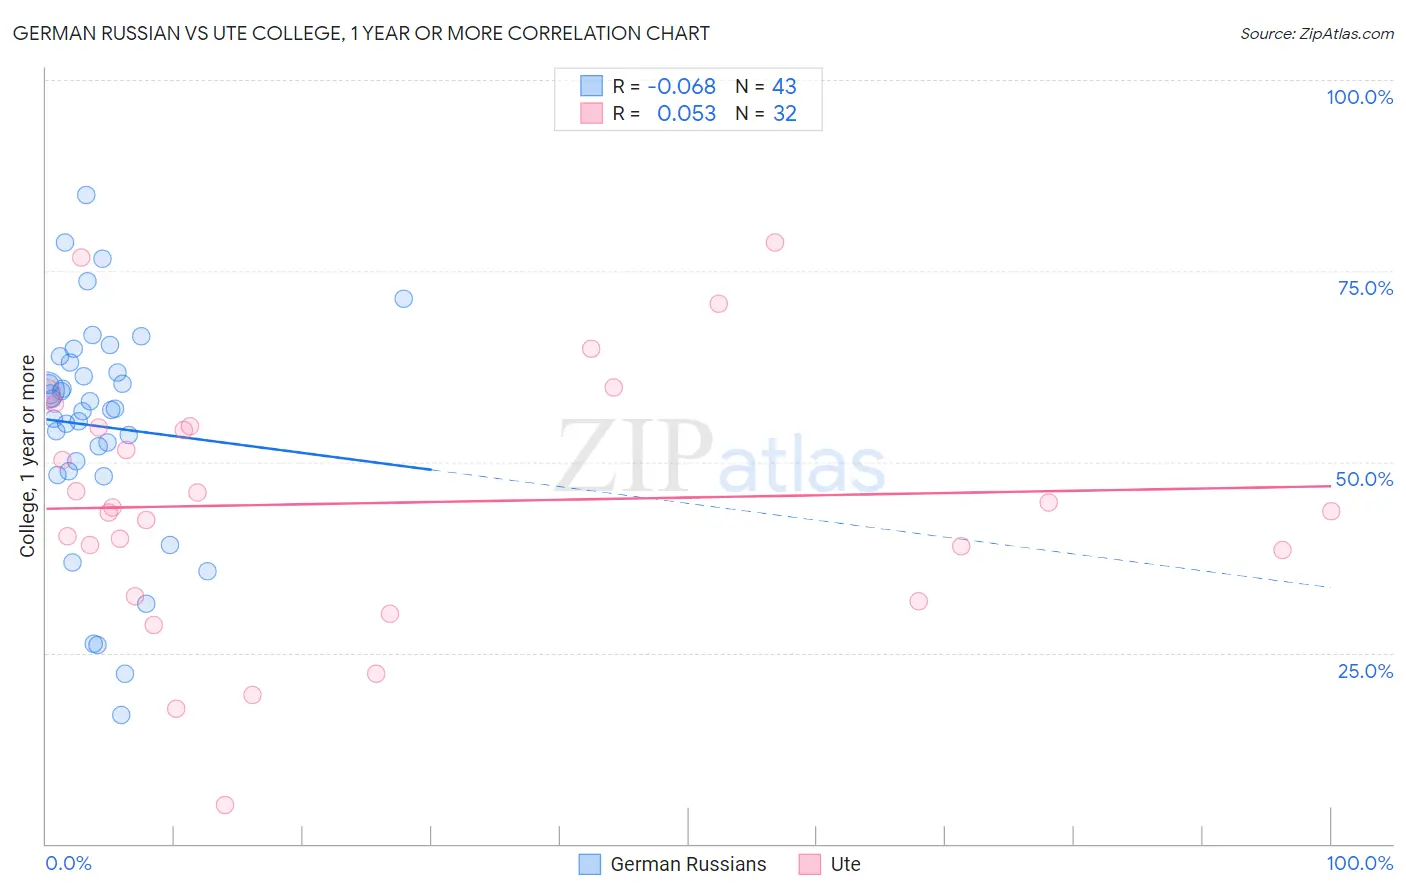
German Russian vs Ute College, 1 year or more Correlation Chart
The statistical analysis conducted on geographies consisting of 96,461,984 people shows a slight negative correlation between the proportion of German Russians and percentage of population with at least college, 1 year or more education in the United States with a correlation coefficient (R) of -0.068 and weighted average of 59.1%. Similarly, the statistical analysis conducted on geographies consisting of 55,668,599 people shows a slight positive correlation between the proportion of Ute and percentage of population with at least college, 1 year or more education in the United States with a correlation coefficient (R) of 0.053 and weighted average of 53.8%, a difference of 9.8%.
College, 1 year or more Correlation Summary
| Measurement | German Russian | Ute |
| Minimum | 16.9% | 5.1% |
| Maximum | 84.9% | 78.7% |
| Range | 68.0% | 73.6% |
| Mean | 54.7% | 44.6% |
| Median | 57.0% | 43.8% |
| Interquartile 25% (IQ1) | 48.8% | 35.4% |
| Interquartile 75% (IQ3) | 63.0% | 54.6% |
| Interquartile Range (IQR) | 14.2% | 19.2% |
| Standard Deviation (Sample) | 14.9% | 16.7% |
| Standard Deviation (Population) | 14.7% | 16.4% |
Similar Demographics by College, 1 year or more
Demographics Similar to German Russians by College, 1 year or more
In terms of college, 1 year or more, the demographic groups most similar to German Russians are Spaniard (59.0%, a difference of 0.060%), Immigrants from Bosnia and Herzegovina (59.2%, a difference of 0.19%), South American (59.0%, a difference of 0.20%), Swiss (59.2%, a difference of 0.22%), and Yugoslavian (59.2%, a difference of 0.26%).
| Demographics | Rating | Rank | College, 1 year or more |
| Immigrants | Poland | 48.9 /100 | #176 | Average 59.4% |
| Tlingit-Haida | 48.4 /100 | #177 | Average 59.4% |
| Czechoslovakians | 48.3 /100 | #178 | Average 59.4% |
| Bermudans | 46.6 /100 | #179 | Average 59.3% |
| Yugoslavians | 44.1 /100 | #180 | Average 59.2% |
| Swiss | 43.4 /100 | #181 | Average 59.2% |
| Immigrants | Bosnia and Herzegovina | 42.8 /100 | #182 | Average 59.2% |
| German Russians | 39.3 /100 | #183 | Fair 59.1% |
| Spaniards | 38.3 /100 | #184 | Fair 59.0% |
| South Americans | 35.9 /100 | #185 | Fair 59.0% |
| Scotch-Irish | 34.7 /100 | #186 | Fair 58.9% |
| Germans | 34.7 /100 | #187 | Fair 58.9% |
| French | 34.4 /100 | #188 | Fair 58.9% |
| Uruguayans | 31.8 /100 | #189 | Fair 58.8% |
| Immigrants | Cameroon | 31.2 /100 | #190 | Fair 58.8% |
Demographics Similar to Ute by College, 1 year or more
In terms of college, 1 year or more, the demographic groups most similar to Ute are Nicaraguan (53.9%, a difference of 0.17%), Immigrants from Guyana (53.5%, a difference of 0.46%), Central American Indian (53.5%, a difference of 0.51%), Guyanese (54.1%, a difference of 0.53%), and Immigrants from Belize (53.5%, a difference of 0.54%).
| Demographics | Rating | Rank | College, 1 year or more |
| Ecuadorians | 0.2 /100 | #277 | Tragic 54.3% |
| Immigrants | Jamaica | 0.1 /100 | #278 | Tragic 54.2% |
| Arapaho | 0.1 /100 | #279 | Tragic 54.1% |
| Cheyenne | 0.1 /100 | #280 | Tragic 54.1% |
| Colville | 0.1 /100 | #281 | Tragic 54.1% |
| Guyanese | 0.1 /100 | #282 | Tragic 54.1% |
| Nicaraguans | 0.1 /100 | #283 | Tragic 53.9% |
| Ute | 0.1 /100 | #284 | Tragic 53.8% |
| Immigrants | Guyana | 0.1 /100 | #285 | Tragic 53.5% |
| Central American Indians | 0.1 /100 | #286 | Tragic 53.5% |
| Immigrants | Belize | 0.1 /100 | #287 | Tragic 53.5% |
| Alaska Natives | 0.0 /100 | #288 | Tragic 53.4% |
| Immigrants | Ecuador | 0.0 /100 | #289 | Tragic 53.4% |
| Alaskan Athabascans | 0.0 /100 | #290 | Tragic 53.4% |
| Cubans | 0.0 /100 | #291 | Tragic 53.4% |