Immigrants from Armenia vs Ute College, 1 year or more
COMPARE
Immigrants from Armenia
Ute
College, 1 year or more
College, 1 year or more Comparison
Immigrants from Armenia
Ute
60.0%
COLLEGE, 1 YEAR OR MORE
68.8/ 100
METRIC RATING
157th/ 347
METRIC RANK
53.8%
COLLEGE, 1 YEAR OR MORE
0.1/ 100
METRIC RATING
284th/ 347
METRIC RANK
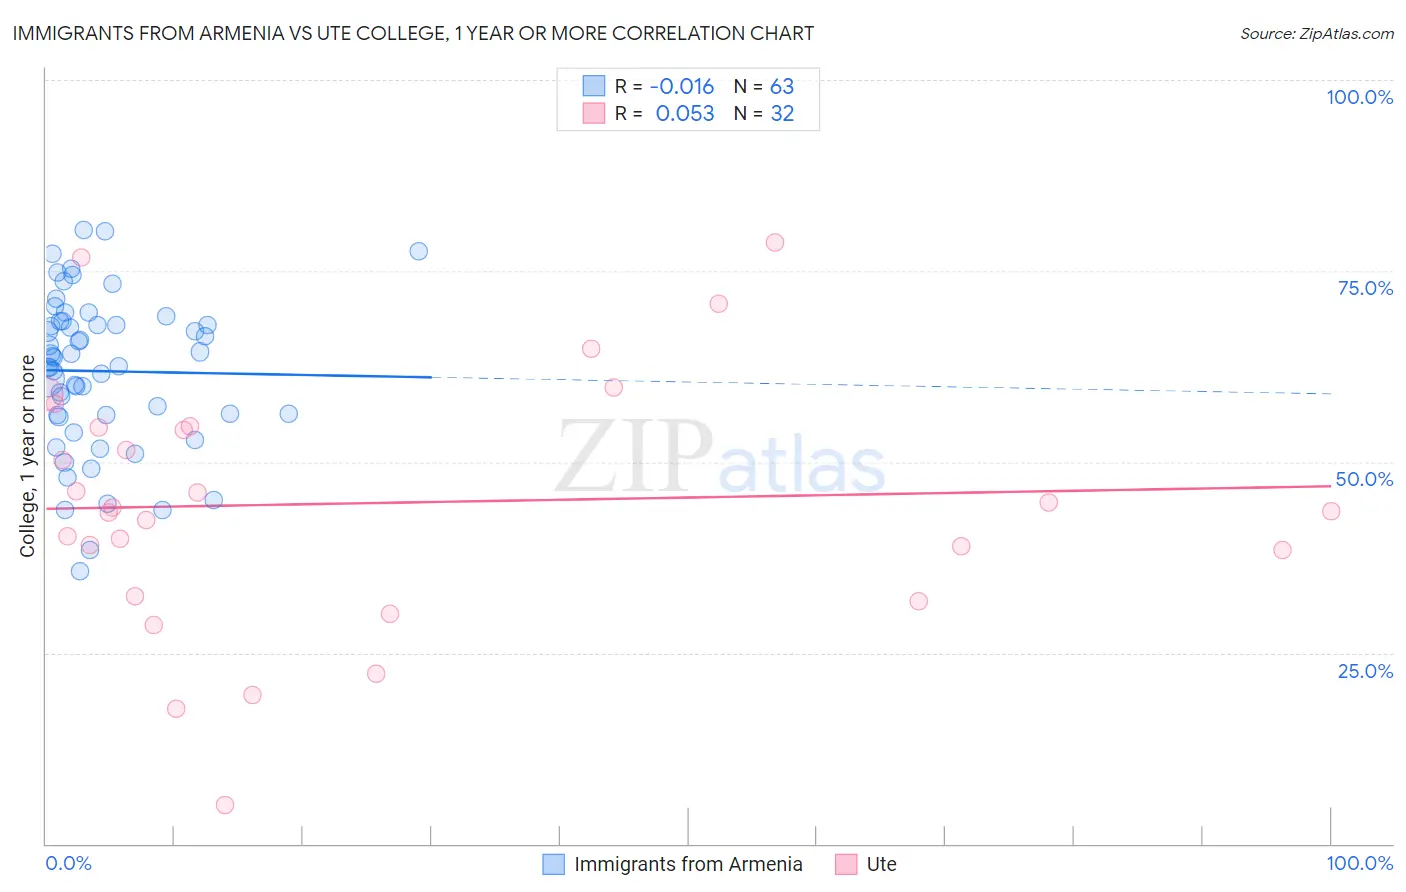
Immigrants from Armenia vs Ute College, 1 year or more Correlation Chart
The statistical analysis conducted on geographies consisting of 97,725,183 people shows no correlation between the proportion of Immigrants from Armenia and percentage of population with at least college, 1 year or more education in the United States with a correlation coefficient (R) of -0.016 and weighted average of 60.0%. Similarly, the statistical analysis conducted on geographies consisting of 55,668,599 people shows a slight positive correlation between the proportion of Ute and percentage of population with at least college, 1 year or more education in the United States with a correlation coefficient (R) of 0.053 and weighted average of 53.8%, a difference of 11.6%.
College, 1 year or more Correlation Summary
| Measurement | Immigrants from Armenia | Ute |
| Minimum | 35.7% | 5.1% |
| Maximum | 80.4% | 78.7% |
| Range | 44.7% | 73.6% |
| Mean | 61.9% | 44.6% |
| Median | 63.7% | 43.8% |
| Interquartile 25% (IQ1) | 56.2% | 35.4% |
| Interquartile 75% (IQ3) | 68.3% | 54.6% |
| Interquartile Range (IQR) | 12.2% | 19.2% |
| Standard Deviation (Sample) | 10.1% | 16.7% |
| Standard Deviation (Population) | 10.0% | 16.4% |
Similar Demographics by College, 1 year or more
Demographics Similar to Immigrants from Armenia by College, 1 year or more
In terms of college, 1 year or more, the demographic groups most similar to Immigrants from Armenia are English (60.0%, a difference of 0.10%), Immigrants from Iraq (60.0%, a difference of 0.11%), South American Indian (60.0%, a difference of 0.12%), Somali (59.9%, a difference of 0.25%), and Sudanese (60.2%, a difference of 0.26%).
| Demographics | Rating | Rank | College, 1 year or more |
| Immigrants | Sudan | 77.8 /100 | #150 | Good 60.4% |
| Albanians | 77.8 /100 | #151 | Good 60.4% |
| Immigrants | Germany | 76.1 /100 | #152 | Good 60.3% |
| Sierra Leoneans | 74.1 /100 | #153 | Good 60.2% |
| Sudanese | 73.0 /100 | #154 | Good 60.2% |
| Moroccans | 72.9 /100 | #155 | Good 60.2% |
| Finns | 72.9 /100 | #156 | Good 60.2% |
| Immigrants | Armenia | 68.8 /100 | #157 | Good 60.0% |
| English | 67.2 /100 | #158 | Good 60.0% |
| Immigrants | Iraq | 67.0 /100 | #159 | Good 60.0% |
| South American Indians | 66.9 /100 | #160 | Good 60.0% |
| Somalis | 64.5 /100 | #161 | Good 59.9% |
| Koreans | 58.5 /100 | #162 | Average 59.7% |
| Immigrants | Somalia | 58.3 /100 | #163 | Average 59.7% |
| Belgians | 58.1 /100 | #164 | Average 59.7% |
Demographics Similar to Ute by College, 1 year or more
In terms of college, 1 year or more, the demographic groups most similar to Ute are Nicaraguan (53.9%, a difference of 0.17%), Immigrants from Guyana (53.5%, a difference of 0.46%), Central American Indian (53.5%, a difference of 0.51%), Guyanese (54.1%, a difference of 0.53%), and Immigrants from Belize (53.5%, a difference of 0.54%).
| Demographics | Rating | Rank | College, 1 year or more |
| Ecuadorians | 0.2 /100 | #277 | Tragic 54.3% |
| Immigrants | Jamaica | 0.1 /100 | #278 | Tragic 54.2% |
| Arapaho | 0.1 /100 | #279 | Tragic 54.1% |
| Cheyenne | 0.1 /100 | #280 | Tragic 54.1% |
| Colville | 0.1 /100 | #281 | Tragic 54.1% |
| Guyanese | 0.1 /100 | #282 | Tragic 54.1% |
| Nicaraguans | 0.1 /100 | #283 | Tragic 53.9% |
| Ute | 0.1 /100 | #284 | Tragic 53.8% |
| Immigrants | Guyana | 0.1 /100 | #285 | Tragic 53.5% |
| Central American Indians | 0.1 /100 | #286 | Tragic 53.5% |
| Immigrants | Belize | 0.1 /100 | #287 | Tragic 53.5% |
| Alaska Natives | 0.0 /100 | #288 | Tragic 53.4% |
| Immigrants | Ecuador | 0.0 /100 | #289 | Tragic 53.4% |
| Alaskan Athabascans | 0.0 /100 | #290 | Tragic 53.4% |
| Cubans | 0.0 /100 | #291 | Tragic 53.4% |