Immigrants from Iraq vs Cypriot Associate's Degree
COMPARE
Immigrants from Iraq
Cypriot
Associate's Degree
Associate's Degree Comparison
Immigrants from Iraq
Cypriots
46.4%
ASSOCIATE'S DEGREE
50.3/ 100
METRIC RATING
173rd/ 347
METRIC RANK
56.4%
ASSOCIATE'S DEGREE
100.0/ 100
METRIC RATING
10th/ 347
METRIC RANK
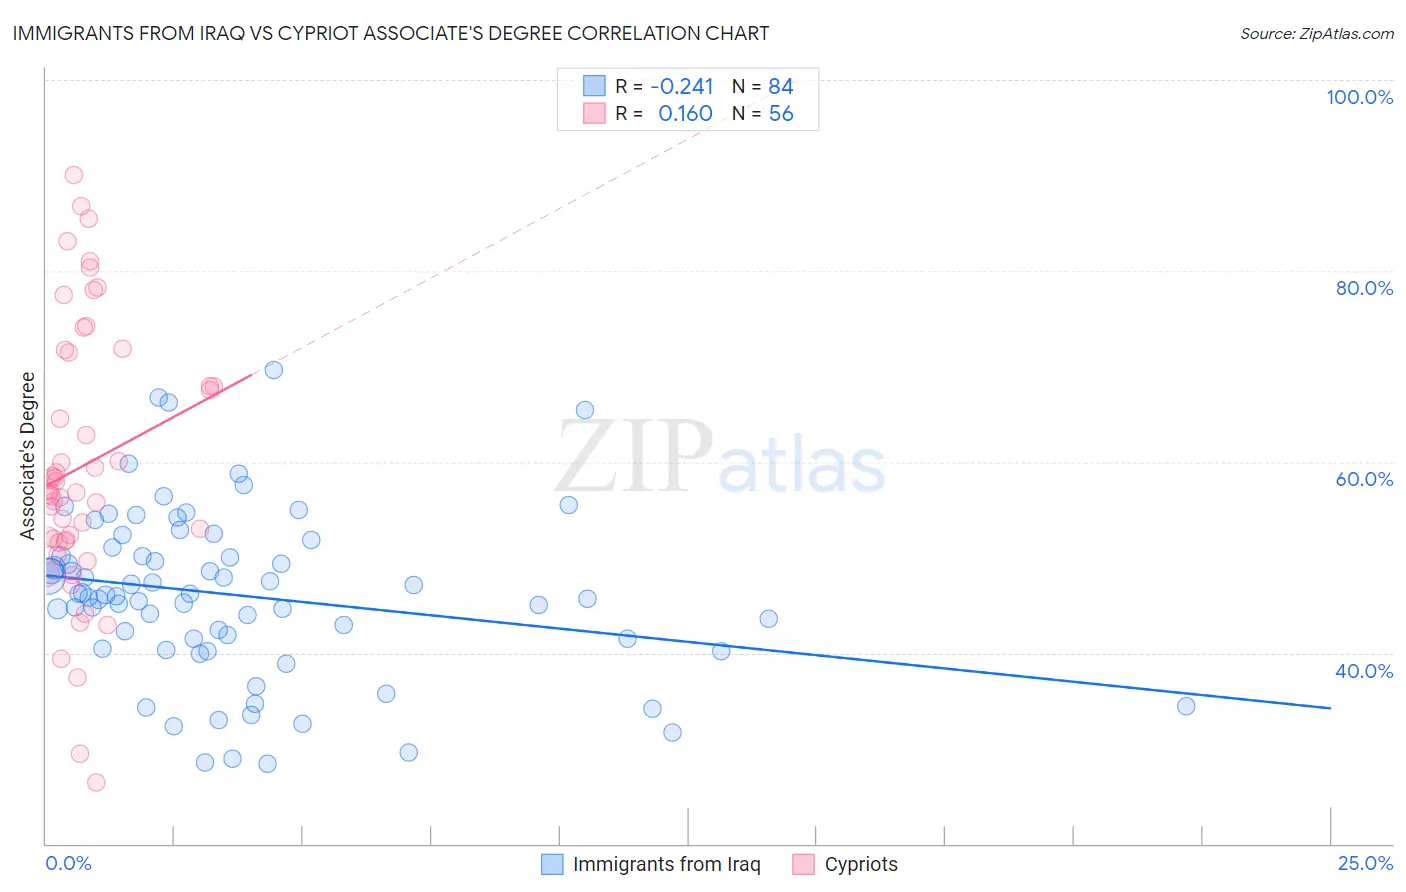
Immigrants from Iraq vs Cypriot Associate's Degree Correlation Chart
The statistical analysis conducted on geographies consisting of 194,756,177 people shows a weak negative correlation between the proportion of Immigrants from Iraq and percentage of population with at least associate's degree education in the United States with a correlation coefficient (R) of -0.241 and weighted average of 46.4%. Similarly, the statistical analysis conducted on geographies consisting of 61,863,675 people shows a poor positive correlation between the proportion of Cypriots and percentage of population with at least associate's degree education in the United States with a correlation coefficient (R) of 0.160 and weighted average of 56.4%, a difference of 21.6%.
Associate's Degree Correlation Summary
| Measurement | Immigrants from Iraq | Cypriot |
| Minimum | 28.4% | 26.5% |
| Maximum | 69.6% | 90.0% |
| Range | 41.2% | 63.5% |
| Mean | 46.0% | 59.5% |
| Median | 46.0% | 56.9% |
| Interquartile 25% (IQ1) | 40.9% | 51.8% |
| Interquartile 75% (IQ3) | 50.6% | 69.7% |
| Interquartile Range (IQR) | 9.7% | 17.9% |
| Standard Deviation (Sample) | 8.8% | 14.0% |
| Standard Deviation (Population) | 8.8% | 13.9% |
Similar Demographics by Associate's Degree
Demographics Similar to Immigrants from Iraq by Associate's Degree
In terms of associate's degree, the demographic groups most similar to Immigrants from Iraq are Peruvian (46.4%, a difference of 0.020%), English (46.4%, a difference of 0.020%), Belgian (46.3%, a difference of 0.10%), Finnish (46.3%, a difference of 0.13%), and Slovak (46.3%, a difference of 0.14%).
| Demographics | Rating | Rank | Associate's Degree |
| Hungarians | 59.3 /100 | #166 | Average 46.7% |
| Immigrants | Sierra Leone | 59.2 /100 | #167 | Average 46.7% |
| Immigrants | Somalia | 55.5 /100 | #168 | Average 46.5% |
| Uruguayans | 55.4 /100 | #169 | Average 46.5% |
| Irish | 53.6 /100 | #170 | Average 46.5% |
| Basques | 52.8 /100 | #171 | Average 46.5% |
| Peruvians | 50.5 /100 | #172 | Average 46.4% |
| Immigrants | Iraq | 50.3 /100 | #173 | Average 46.4% |
| English | 50.0 /100 | #174 | Average 46.4% |
| Belgians | 48.9 /100 | #175 | Average 46.3% |
| Finns | 48.5 /100 | #176 | Average 46.3% |
| Slovaks | 48.4 /100 | #177 | Average 46.3% |
| Immigrants | Bosnia and Herzegovina | 48.3 /100 | #178 | Average 46.3% |
| Sri Lankans | 47.6 /100 | #179 | Average 46.3% |
| Bermudans | 46.4 /100 | #180 | Average 46.2% |
Demographics Similar to Cypriots by Associate's Degree
In terms of associate's degree, the demographic groups most similar to Cypriots are Immigrants from Israel (56.8%, a difference of 0.72%), Immigrants from Australia (55.8%, a difference of 1.0%), Immigrants from South Central Asia (55.7%, a difference of 1.1%), Immigrants from China (55.5%, a difference of 1.7%), and Immigrants from Hong Kong (55.4%, a difference of 1.8%).
| Demographics | Rating | Rank | Associate's Degree |
| Immigrants | India | 100.0 /100 | #3 | Exceptional 58.5% |
| Immigrants | Taiwan | 100.0 /100 | #4 | Exceptional 58.4% |
| Iranians | 100.0 /100 | #5 | Exceptional 58.2% |
| Okinawans | 100.0 /100 | #6 | Exceptional 57.7% |
| Immigrants | Iran | 100.0 /100 | #7 | Exceptional 57.7% |
| Thais | 100.0 /100 | #8 | Exceptional 57.4% |
| Immigrants | Israel | 100.0 /100 | #9 | Exceptional 56.8% |
| Cypriots | 100.0 /100 | #10 | Exceptional 56.4% |
| Immigrants | Australia | 100.0 /100 | #11 | Exceptional 55.8% |
| Immigrants | South Central Asia | 100.0 /100 | #12 | Exceptional 55.7% |
| Immigrants | China | 100.0 /100 | #13 | Exceptional 55.5% |
| Immigrants | Hong Kong | 100.0 /100 | #14 | Exceptional 55.4% |
| Immigrants | Eastern Asia | 100.0 /100 | #15 | Exceptional 55.4% |
| Soviet Union | 100.0 /100 | #16 | Exceptional 55.1% |
| Eastern Europeans | 100.0 /100 | #17 | Exceptional 55.0% |