Icelander vs Cypriot Associate's Degree
COMPARE
Icelander
Cypriot
Associate's Degree
Associate's Degree Comparison
Icelanders
Cypriots
48.3%
ASSOCIATE'S DEGREE
90.8/ 100
METRIC RATING
131st/ 347
METRIC RANK
56.4%
ASSOCIATE'S DEGREE
100.0/ 100
METRIC RATING
10th/ 347
METRIC RANK
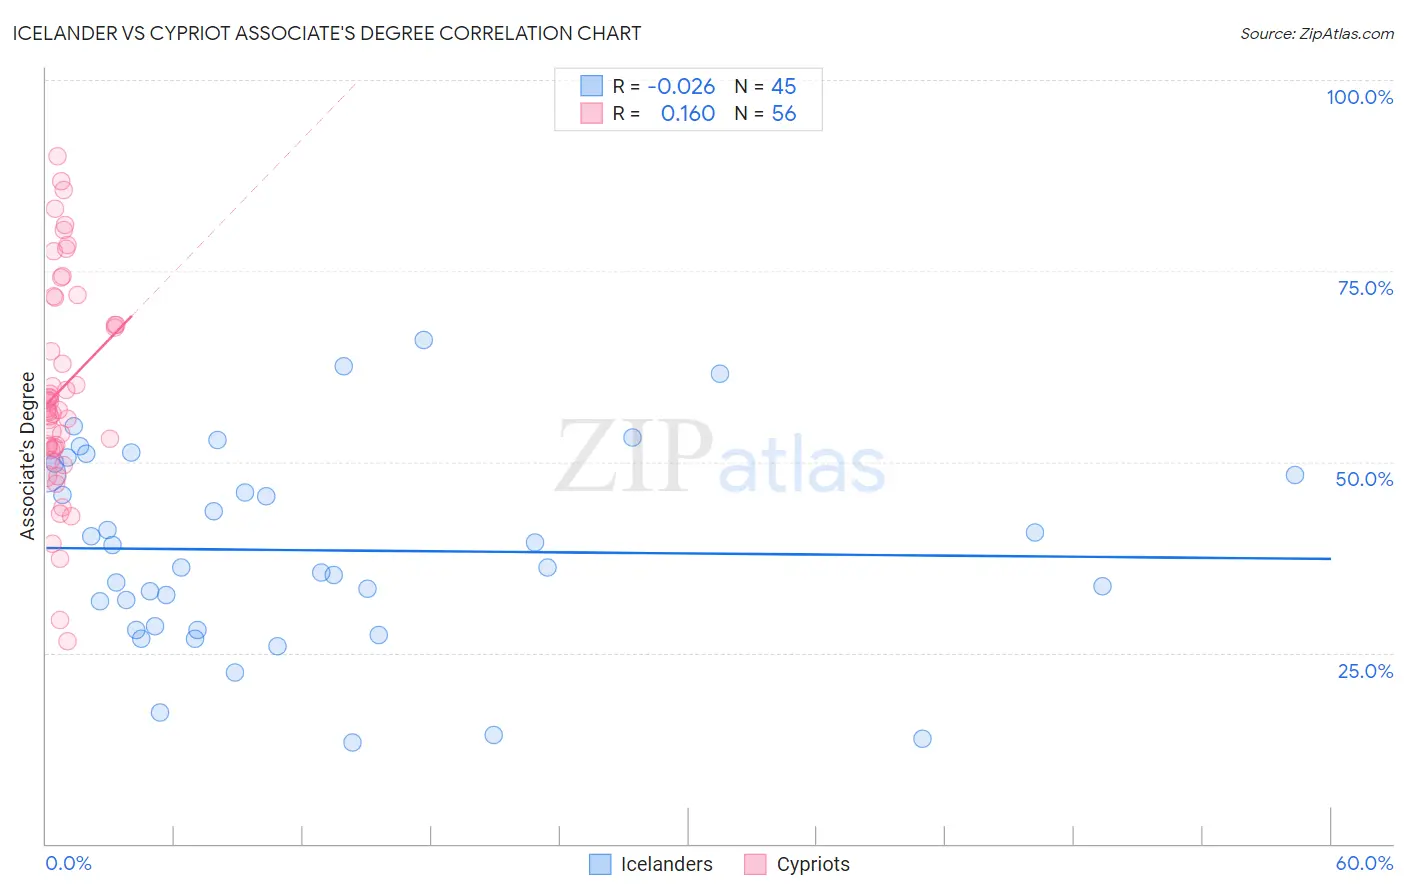
Icelander vs Cypriot Associate's Degree Correlation Chart
The statistical analysis conducted on geographies consisting of 159,662,338 people shows no correlation between the proportion of Icelanders and percentage of population with at least associate's degree education in the United States with a correlation coefficient (R) of -0.026 and weighted average of 48.3%. Similarly, the statistical analysis conducted on geographies consisting of 61,863,675 people shows a poor positive correlation between the proportion of Cypriots and percentage of population with at least associate's degree education in the United States with a correlation coefficient (R) of 0.160 and weighted average of 56.4%, a difference of 16.7%.
Associate's Degree Correlation Summary
| Measurement | Icelander | Cypriot |
| Minimum | 13.3% | 26.5% |
| Maximum | 66.0% | 90.0% |
| Range | 52.6% | 63.5% |
| Mean | 38.4% | 59.5% |
| Median | 36.2% | 56.9% |
| Interquartile 25% (IQ1) | 28.2% | 51.8% |
| Interquartile 75% (IQ3) | 49.1% | 69.7% |
| Interquartile Range (IQR) | 20.9% | 17.9% |
| Standard Deviation (Sample) | 13.0% | 14.0% |
| Standard Deviation (Population) | 12.8% | 13.9% |
Similar Demographics by Associate's Degree
Demographics Similar to Icelanders by Associate's Degree
In terms of associate's degree, the demographic groups most similar to Icelanders are Immigrants from Jordan (48.4%, a difference of 0.10%), Swedish (48.4%, a difference of 0.16%), Immigrants from Albania (48.2%, a difference of 0.18%), Immigrants from Eastern Africa (48.4%, a difference of 0.19%), and Assyrian/Chaldean/Syriac (48.2%, a difference of 0.27%).
| Demographics | Rating | Rank | Associate's Degree |
| Serbians | 92.6 /100 | #124 | Exceptional 48.5% |
| Chinese | 92.5 /100 | #125 | Exceptional 48.5% |
| Immigrants | Syria | 92.2 /100 | #126 | Exceptional 48.5% |
| Immigrants | Uganda | 92.1 /100 | #127 | Exceptional 48.5% |
| Immigrants | Eastern Africa | 91.6 /100 | #128 | Exceptional 48.4% |
| Swedes | 91.5 /100 | #129 | Exceptional 48.4% |
| Immigrants | Jordan | 91.2 /100 | #130 | Exceptional 48.4% |
| Icelanders | 90.8 /100 | #131 | Exceptional 48.3% |
| Immigrants | Albania | 89.9 /100 | #132 | Excellent 48.2% |
| Assyrians/Chaldeans/Syriacs | 89.4 /100 | #133 | Excellent 48.2% |
| Moroccans | 89.3 /100 | #134 | Excellent 48.2% |
| Europeans | 89.0 /100 | #135 | Excellent 48.2% |
| Pakistanis | 88.0 /100 | #136 | Excellent 48.1% |
| Immigrants | Eritrea | 87.8 /100 | #137 | Excellent 48.1% |
| Poles | 87.3 /100 | #138 | Excellent 48.0% |
Demographics Similar to Cypriots by Associate's Degree
In terms of associate's degree, the demographic groups most similar to Cypriots are Immigrants from Israel (56.8%, a difference of 0.72%), Immigrants from Australia (55.8%, a difference of 1.0%), Immigrants from South Central Asia (55.7%, a difference of 1.1%), Immigrants from China (55.5%, a difference of 1.7%), and Immigrants from Hong Kong (55.4%, a difference of 1.8%).
| Demographics | Rating | Rank | Associate's Degree |
| Immigrants | India | 100.0 /100 | #3 | Exceptional 58.5% |
| Immigrants | Taiwan | 100.0 /100 | #4 | Exceptional 58.4% |
| Iranians | 100.0 /100 | #5 | Exceptional 58.2% |
| Okinawans | 100.0 /100 | #6 | Exceptional 57.7% |
| Immigrants | Iran | 100.0 /100 | #7 | Exceptional 57.7% |
| Thais | 100.0 /100 | #8 | Exceptional 57.4% |
| Immigrants | Israel | 100.0 /100 | #9 | Exceptional 56.8% |
| Cypriots | 100.0 /100 | #10 | Exceptional 56.4% |
| Immigrants | Australia | 100.0 /100 | #11 | Exceptional 55.8% |
| Immigrants | South Central Asia | 100.0 /100 | #12 | Exceptional 55.7% |
| Immigrants | China | 100.0 /100 | #13 | Exceptional 55.5% |
| Immigrants | Hong Kong | 100.0 /100 | #14 | Exceptional 55.4% |
| Immigrants | Eastern Asia | 100.0 /100 | #15 | Exceptional 55.4% |
| Soviet Union | 100.0 /100 | #16 | Exceptional 55.1% |
| Eastern Europeans | 100.0 /100 | #17 | Exceptional 55.0% |