Immigrants from Northern Africa vs Cypriot Associate's Degree
COMPARE
Immigrants from Northern Africa
Cypriot
Associate's Degree
Associate's Degree Comparison
Immigrants from Northern Africa
Cypriots
49.7%
ASSOCIATE'S DEGREE
97.9/ 100
METRIC RATING
98th/ 347
METRIC RANK
56.4%
ASSOCIATE'S DEGREE
100.0/ 100
METRIC RATING
10th/ 347
METRIC RANK
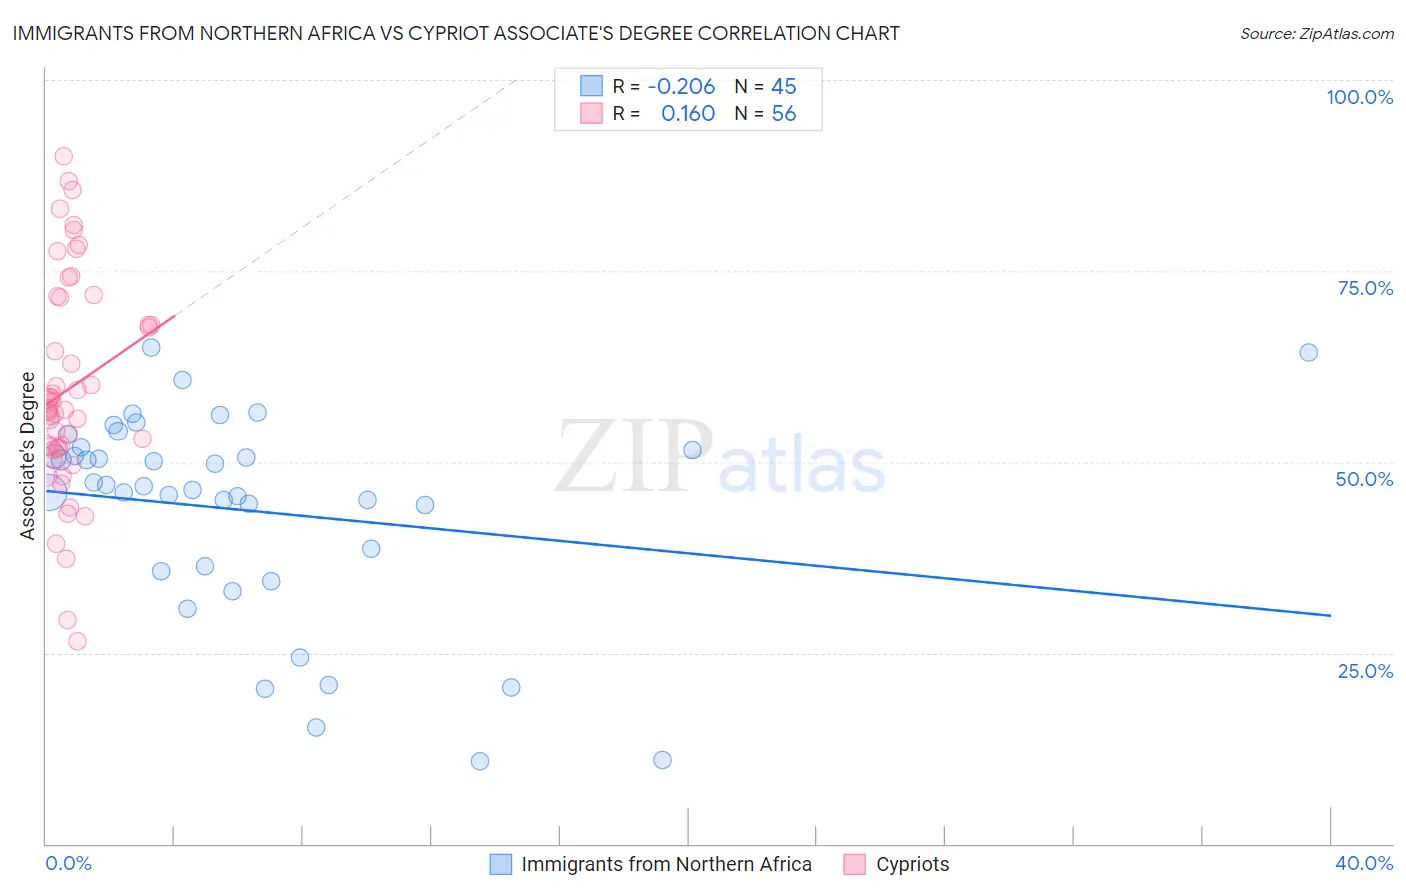
Immigrants from Northern Africa vs Cypriot Associate's Degree Correlation Chart
The statistical analysis conducted on geographies consisting of 321,197,052 people shows a weak negative correlation between the proportion of Immigrants from Northern Africa and percentage of population with at least associate's degree education in the United States with a correlation coefficient (R) of -0.206 and weighted average of 49.7%. Similarly, the statistical analysis conducted on geographies consisting of 61,863,675 people shows a poor positive correlation between the proportion of Cypriots and percentage of population with at least associate's degree education in the United States with a correlation coefficient (R) of 0.160 and weighted average of 56.4%, a difference of 13.5%.
Associate's Degree Correlation Summary
| Measurement | Immigrants from Northern Africa | Cypriot |
| Minimum | 10.8% | 26.5% |
| Maximum | 65.0% | 90.0% |
| Range | 54.2% | 63.5% |
| Mean | 43.6% | 59.5% |
| Median | 46.7% | 56.9% |
| Interquartile 25% (IQ1) | 36.0% | 51.8% |
| Interquartile 75% (IQ3) | 51.8% | 69.7% |
| Interquartile Range (IQR) | 15.8% | 17.9% |
| Standard Deviation (Sample) | 13.6% | 14.0% |
| Standard Deviation (Population) | 13.4% | 13.9% |
Similar Demographics by Associate's Degree
Demographics Similar to Immigrants from Northern Africa by Associate's Degree
In terms of associate's degree, the demographic groups most similar to Immigrants from Northern Africa are Macedonian (49.6%, a difference of 0.070%), Romanian (49.7%, a difference of 0.090%), Immigrants from Ukraine (49.7%, a difference of 0.090%), Immigrants from England (49.7%, a difference of 0.11%), and Immigrants from Nepal (49.5%, a difference of 0.28%).
| Demographics | Rating | Rank | Associate's Degree |
| Immigrants | Western Asia | 98.7 /100 | #91 | Exceptional 50.1% |
| Immigrants | North America | 98.7 /100 | #92 | Exceptional 50.1% |
| Immigrants | Brazil | 98.5 /100 | #93 | Exceptional 50.0% |
| Laotians | 98.4 /100 | #94 | Exceptional 49.9% |
| Immigrants | England | 98.0 /100 | #95 | Exceptional 49.7% |
| Romanians | 98.0 /100 | #96 | Exceptional 49.7% |
| Immigrants | Ukraine | 98.0 /100 | #97 | Exceptional 49.7% |
| Immigrants | Northern Africa | 97.9 /100 | #98 | Exceptional 49.7% |
| Macedonians | 97.8 /100 | #99 | Exceptional 49.6% |
| Immigrants | Nepal | 97.5 /100 | #100 | Exceptional 49.5% |
| Northern Europeans | 97.3 /100 | #101 | Exceptional 49.5% |
| Chileans | 97.3 /100 | #102 | Exceptional 49.4% |
| Ukrainians | 97.1 /100 | #103 | Exceptional 49.4% |
| Venezuelans | 97.0 /100 | #104 | Exceptional 49.4% |
| Croatians | 96.8 /100 | #105 | Exceptional 49.3% |
Demographics Similar to Cypriots by Associate's Degree
In terms of associate's degree, the demographic groups most similar to Cypriots are Immigrants from Israel (56.8%, a difference of 0.72%), Immigrants from Australia (55.8%, a difference of 1.0%), Immigrants from South Central Asia (55.7%, a difference of 1.1%), Immigrants from China (55.5%, a difference of 1.7%), and Immigrants from Hong Kong (55.4%, a difference of 1.8%).
| Demographics | Rating | Rank | Associate's Degree |
| Immigrants | India | 100.0 /100 | #3 | Exceptional 58.5% |
| Immigrants | Taiwan | 100.0 /100 | #4 | Exceptional 58.4% |
| Iranians | 100.0 /100 | #5 | Exceptional 58.2% |
| Okinawans | 100.0 /100 | #6 | Exceptional 57.7% |
| Immigrants | Iran | 100.0 /100 | #7 | Exceptional 57.7% |
| Thais | 100.0 /100 | #8 | Exceptional 57.4% |
| Immigrants | Israel | 100.0 /100 | #9 | Exceptional 56.8% |
| Cypriots | 100.0 /100 | #10 | Exceptional 56.4% |
| Immigrants | Australia | 100.0 /100 | #11 | Exceptional 55.8% |
| Immigrants | South Central Asia | 100.0 /100 | #12 | Exceptional 55.7% |
| Immigrants | China | 100.0 /100 | #13 | Exceptional 55.5% |
| Immigrants | Hong Kong | 100.0 /100 | #14 | Exceptional 55.4% |
| Immigrants | Eastern Asia | 100.0 /100 | #15 | Exceptional 55.4% |
| Soviet Union | 100.0 /100 | #16 | Exceptional 55.1% |
| Eastern Europeans | 100.0 /100 | #17 | Exceptional 55.0% |