Immigrants from Iraq vs Japanese Associate's Degree
COMPARE
Immigrants from Iraq
Japanese
Associate's Degree
Associate's Degree Comparison
Immigrants from Iraq
Japanese
46.4%
ASSOCIATE'S DEGREE
50.3/ 100
METRIC RATING
173rd/ 347
METRIC RANK
41.7%
ASSOCIATE'S DEGREE
0.5/ 100
METRIC RATING
258th/ 347
METRIC RANK
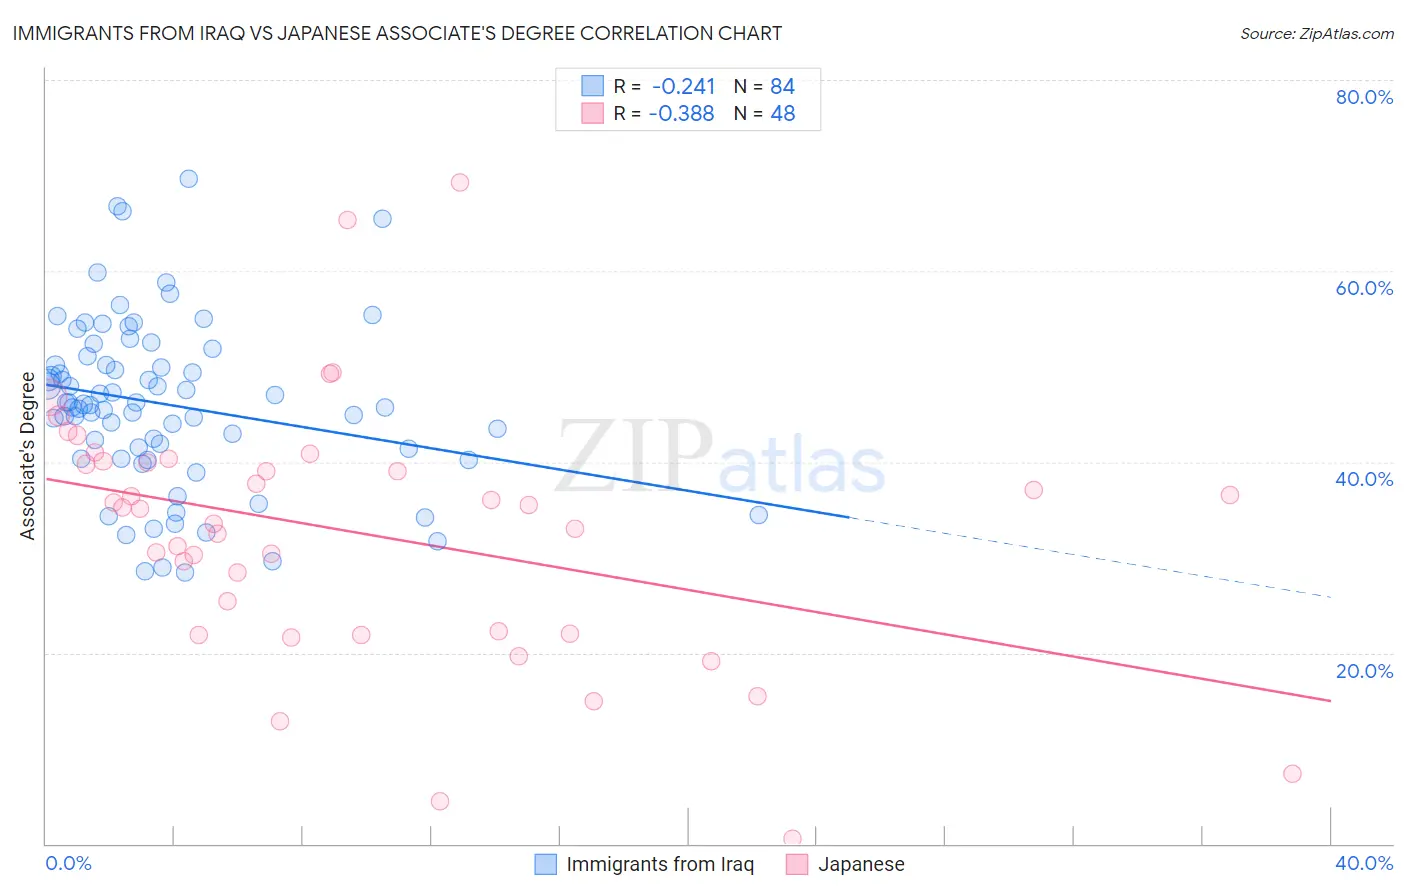
Immigrants from Iraq vs Japanese Associate's Degree Correlation Chart
The statistical analysis conducted on geographies consisting of 194,756,177 people shows a weak negative correlation between the proportion of Immigrants from Iraq and percentage of population with at least associate's degree education in the United States with a correlation coefficient (R) of -0.241 and weighted average of 46.4%. Similarly, the statistical analysis conducted on geographies consisting of 249,174,886 people shows a mild negative correlation between the proportion of Japanese and percentage of population with at least associate's degree education in the United States with a correlation coefficient (R) of -0.388 and weighted average of 41.7%, a difference of 11.2%.
Associate's Degree Correlation Summary
| Measurement | Immigrants from Iraq | Japanese |
| Minimum | 28.4% | 0.50% |
| Maximum | 69.6% | 69.2% |
| Range | 41.2% | 68.7% |
| Mean | 46.0% | 32.6% |
| Median | 46.0% | 35.1% |
| Interquartile 25% (IQ1) | 40.9% | 22.1% |
| Interquartile 75% (IQ3) | 50.6% | 40.0% |
| Interquartile Range (IQR) | 9.7% | 17.9% |
| Standard Deviation (Sample) | 8.8% | 13.5% |
| Standard Deviation (Population) | 8.8% | 13.4% |
Similar Demographics by Associate's Degree
Demographics Similar to Immigrants from Iraq by Associate's Degree
In terms of associate's degree, the demographic groups most similar to Immigrants from Iraq are Peruvian (46.4%, a difference of 0.020%), English (46.4%, a difference of 0.020%), Belgian (46.3%, a difference of 0.10%), Finnish (46.3%, a difference of 0.13%), and Slovak (46.3%, a difference of 0.14%).
| Demographics | Rating | Rank | Associate's Degree |
| Hungarians | 59.3 /100 | #166 | Average 46.7% |
| Immigrants | Sierra Leone | 59.2 /100 | #167 | Average 46.7% |
| Immigrants | Somalia | 55.5 /100 | #168 | Average 46.5% |
| Uruguayans | 55.4 /100 | #169 | Average 46.5% |
| Irish | 53.6 /100 | #170 | Average 46.5% |
| Basques | 52.8 /100 | #171 | Average 46.5% |
| Peruvians | 50.5 /100 | #172 | Average 46.4% |
| Immigrants | Iraq | 50.3 /100 | #173 | Average 46.4% |
| English | 50.0 /100 | #174 | Average 46.4% |
| Belgians | 48.9 /100 | #175 | Average 46.3% |
| Finns | 48.5 /100 | #176 | Average 46.3% |
| Slovaks | 48.4 /100 | #177 | Average 46.3% |
| Immigrants | Bosnia and Herzegovina | 48.3 /100 | #178 | Average 46.3% |
| Sri Lankans | 47.6 /100 | #179 | Average 46.3% |
| Bermudans | 46.4 /100 | #180 | Average 46.2% |
Demographics Similar to Japanese by Associate's Degree
In terms of associate's degree, the demographic groups most similar to Japanese are Malaysian (41.6%, a difference of 0.10%), Spanish American (41.8%, a difference of 0.22%), Immigrants from Congo (41.8%, a difference of 0.27%), Marshallese (41.6%, a difference of 0.30%), and Immigrants from Guyana (41.8%, a difference of 0.40%).
| Demographics | Rating | Rank | Associate's Degree |
| Immigrants | Bahamas | 0.7 /100 | #251 | Tragic 42.1% |
| French American Indians | 0.6 /100 | #252 | Tragic 42.0% |
| Indonesians | 0.6 /100 | #253 | Tragic 41.9% |
| Cubans | 0.6 /100 | #254 | Tragic 41.9% |
| Immigrants | Guyana | 0.5 /100 | #255 | Tragic 41.8% |
| Immigrants | Congo | 0.5 /100 | #256 | Tragic 41.8% |
| Spanish Americans | 0.5 /100 | #257 | Tragic 41.8% |
| Japanese | 0.5 /100 | #258 | Tragic 41.7% |
| Malaysians | 0.4 /100 | #259 | Tragic 41.6% |
| Marshallese | 0.4 /100 | #260 | Tragic 41.6% |
| Nicaraguans | 0.4 /100 | #261 | Tragic 41.5% |
| Bahamians | 0.4 /100 | #262 | Tragic 41.5% |
| Immigrants | Jamaica | 0.3 /100 | #263 | Tragic 41.5% |
| Osage | 0.3 /100 | #264 | Tragic 41.5% |
| Africans | 0.2 /100 | #265 | Tragic 41.1% |