Immigrants from Iraq vs Salvadoran Associate's Degree
COMPARE
Immigrants from Iraq
Salvadoran
Associate's Degree
Associate's Degree Comparison
Immigrants from Iraq
Salvadorans
46.4%
ASSOCIATE'S DEGREE
50.3/ 100
METRIC RATING
173rd/ 347
METRIC RANK
39.0%
ASSOCIATE'S DEGREE
0.0/ 100
METRIC RATING
294th/ 347
METRIC RANK
Immigrants from Iraq vs Salvadoran Associate's Degree Correlation Chart
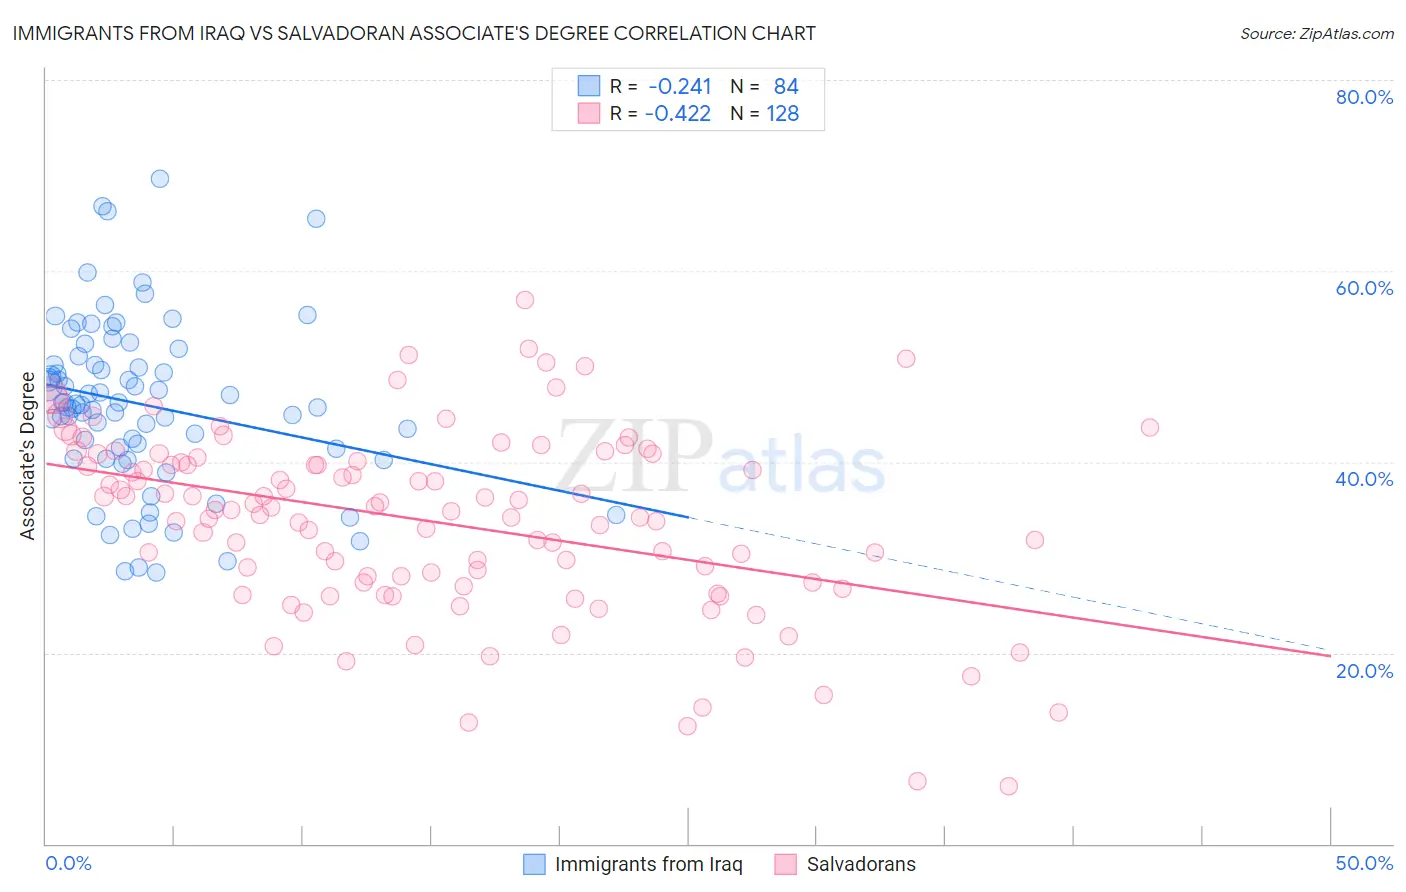
The statistical analysis conducted on geographies consisting of 194,756,177 people shows a weak negative correlation between the proportion of Immigrants from Iraq and percentage of population with at least associate's degree education in the United States with a correlation coefficient (R) of -0.241 and weighted average of 46.4%. Similarly, the statistical analysis conducted on geographies consisting of 399,027,766 people shows a moderate negative correlation between the proportion of Salvadorans and percentage of population with at least associate's degree education in the United States with a correlation coefficient (R) of -0.422 and weighted average of 39.0%, a difference of 18.7%.
Associate's Degree Correlation Summary
| Measurement | Immigrants from Iraq | Salvadoran |
| Minimum | 28.4% | 6.1% |
| Maximum | 69.6% | 57.0% |
| Range | 41.2% | 50.9% |
| Mean | 46.0% | 33.7% |
| Median | 46.0% | 35.0% |
| Interquartile 25% (IQ1) | 40.9% | 27.3% |
| Interquartile 75% (IQ3) | 50.6% | 40.3% |
| Interquartile Range (IQR) | 9.7% | 12.9% |
| Standard Deviation (Sample) | 8.8% | 9.6% |
| Standard Deviation (Population) | 8.8% | 9.5% |
Similar Demographics by Associate's Degree
Demographics Similar to Immigrants from Iraq by Associate's Degree
In terms of associate's degree, the demographic groups most similar to Immigrants from Iraq are Peruvian (46.4%, a difference of 0.020%), English (46.4%, a difference of 0.020%), Belgian (46.3%, a difference of 0.10%), Finnish (46.3%, a difference of 0.13%), and Slovak (46.3%, a difference of 0.14%).
| Demographics | Rating | Rank | Associate's Degree |
| Hungarians | 59.3 /100 | #166 | Average 46.7% |
| Immigrants | Sierra Leone | 59.2 /100 | #167 | Average 46.7% |
| Immigrants | Somalia | 55.5 /100 | #168 | Average 46.5% |
| Uruguayans | 55.4 /100 | #169 | Average 46.5% |
| Irish | 53.6 /100 | #170 | Average 46.5% |
| Basques | 52.8 /100 | #171 | Average 46.5% |
| Peruvians | 50.5 /100 | #172 | Average 46.4% |
| Immigrants | Iraq | 50.3 /100 | #173 | Average 46.4% |
| English | 50.0 /100 | #174 | Average 46.4% |
| Belgians | 48.9 /100 | #175 | Average 46.3% |
| Finns | 48.5 /100 | #176 | Average 46.3% |
| Slovaks | 48.4 /100 | #177 | Average 46.3% |
| Immigrants | Bosnia and Herzegovina | 48.3 /100 | #178 | Average 46.3% |
| Sri Lankans | 47.6 /100 | #179 | Average 46.3% |
| Bermudans | 46.4 /100 | #180 | Average 46.2% |
Demographics Similar to Salvadorans by Associate's Degree
In terms of associate's degree, the demographic groups most similar to Salvadorans are Nepalese (39.0%, a difference of 0.0%), Black/African American (39.1%, a difference of 0.25%), Honduran (38.9%, a difference of 0.29%), Cherokee (38.9%, a difference of 0.46%), and Dominican (39.3%, a difference of 0.54%).
| Demographics | Rating | Rank | Associate's Degree |
| Aleuts | 0.0 /100 | #287 | Tragic 39.6% |
| Immigrants | Cuba | 0.0 /100 | #288 | Tragic 39.5% |
| Central Americans | 0.0 /100 | #289 | Tragic 39.4% |
| Immigrants | Haiti | 0.0 /100 | #290 | Tragic 39.3% |
| Dominicans | 0.0 /100 | #291 | Tragic 39.3% |
| Blacks/African Americans | 0.0 /100 | #292 | Tragic 39.1% |
| Nepalese | 0.0 /100 | #293 | Tragic 39.0% |
| Salvadorans | 0.0 /100 | #294 | Tragic 39.0% |
| Hondurans | 0.0 /100 | #295 | Tragic 38.9% |
| Cherokee | 0.0 /100 | #296 | Tragic 38.9% |
| Cape Verdeans | 0.0 /100 | #297 | Tragic 38.8% |
| Cheyenne | 0.0 /100 | #298 | Tragic 38.7% |
| Ute | 0.0 /100 | #299 | Tragic 38.6% |
| Chickasaw | 0.0 /100 | #300 | Tragic 38.6% |
| Tsimshian | 0.0 /100 | #301 | Tragic 38.6% |