Immigrants from Iraq vs Inupiat Associate's Degree
COMPARE
Immigrants from Iraq
Inupiat
Associate's Degree
Associate's Degree Comparison
Immigrants from Iraq
Inupiat
46.4%
ASSOCIATE'S DEGREE
50.3/ 100
METRIC RATING
173rd/ 347
METRIC RANK
32.6%
ASSOCIATE'S DEGREE
0.0/ 100
METRIC RATING
341st/ 347
METRIC RANK
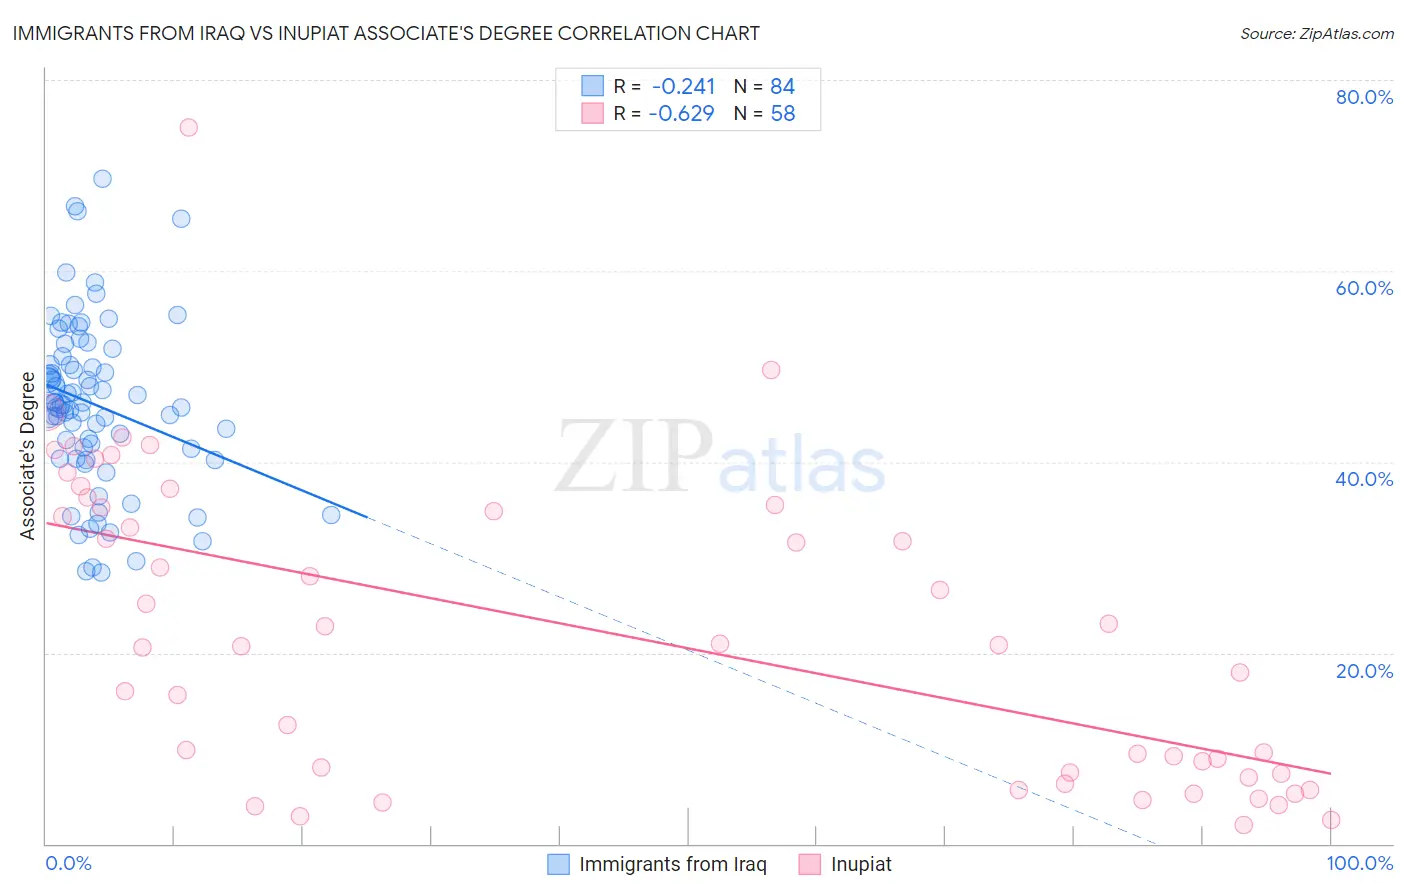
Immigrants from Iraq vs Inupiat Associate's Degree Correlation Chart
The statistical analysis conducted on geographies consisting of 194,756,177 people shows a weak negative correlation between the proportion of Immigrants from Iraq and percentage of population with at least associate's degree education in the United States with a correlation coefficient (R) of -0.241 and weighted average of 46.4%. Similarly, the statistical analysis conducted on geographies consisting of 96,347,955 people shows a significant negative correlation between the proportion of Inupiat and percentage of population with at least associate's degree education in the United States with a correlation coefficient (R) of -0.629 and weighted average of 32.6%, a difference of 42.4%.
Associate's Degree Correlation Summary
| Measurement | Immigrants from Iraq | Inupiat |
| Minimum | 28.4% | 1.9% |
| Maximum | 69.6% | 75.0% |
| Range | 41.2% | 73.1% |
| Mean | 46.0% | 22.0% |
| Median | 46.0% | 20.8% |
| Interquartile 25% (IQ1) | 40.9% | 7.3% |
| Interquartile 75% (IQ3) | 50.6% | 35.2% |
| Interquartile Range (IQR) | 9.7% | 27.9% |
| Standard Deviation (Sample) | 8.8% | 16.0% |
| Standard Deviation (Population) | 8.8% | 15.9% |
Similar Demographics by Associate's Degree
Demographics Similar to Immigrants from Iraq by Associate's Degree
In terms of associate's degree, the demographic groups most similar to Immigrants from Iraq are Peruvian (46.4%, a difference of 0.020%), English (46.4%, a difference of 0.020%), Belgian (46.3%, a difference of 0.10%), Finnish (46.3%, a difference of 0.13%), and Slovak (46.3%, a difference of 0.14%).
| Demographics | Rating | Rank | Associate's Degree |
| Hungarians | 59.3 /100 | #166 | Average 46.7% |
| Immigrants | Sierra Leone | 59.2 /100 | #167 | Average 46.7% |
| Immigrants | Somalia | 55.5 /100 | #168 | Average 46.5% |
| Uruguayans | 55.4 /100 | #169 | Average 46.5% |
| Irish | 53.6 /100 | #170 | Average 46.5% |
| Basques | 52.8 /100 | #171 | Average 46.5% |
| Peruvians | 50.5 /100 | #172 | Average 46.4% |
| Immigrants | Iraq | 50.3 /100 | #173 | Average 46.4% |
| English | 50.0 /100 | #174 | Average 46.4% |
| Belgians | 48.9 /100 | #175 | Average 46.3% |
| Finns | 48.5 /100 | #176 | Average 46.3% |
| Slovaks | 48.4 /100 | #177 | Average 46.3% |
| Immigrants | Bosnia and Herzegovina | 48.3 /100 | #178 | Average 46.3% |
| Sri Lankans | 47.6 /100 | #179 | Average 46.3% |
| Bermudans | 46.4 /100 | #180 | Average 46.2% |
Demographics Similar to Inupiat by Associate's Degree
In terms of associate's degree, the demographic groups most similar to Inupiat are Navajo (32.6%, a difference of 0.050%), Yakama (32.3%, a difference of 0.77%), Tohono O'odham (31.8%, a difference of 2.5%), Immigrants from Mexico (33.7%, a difference of 3.6%), and Yuman (31.3%, a difference of 4.2%).
| Demographics | Rating | Rank | Associate's Degree |
| Mexicans | 0.0 /100 | #333 | Tragic 35.0% |
| Natives/Alaskans | 0.0 /100 | #334 | Tragic 34.9% |
| Spanish American Indians | 0.0 /100 | #335 | Tragic 34.9% |
| Hopi | 0.0 /100 | #336 | Tragic 34.6% |
| Lumbee | 0.0 /100 | #337 | Tragic 34.1% |
| Pueblo | 0.0 /100 | #338 | Tragic 34.0% |
| Immigrants | Mexico | 0.0 /100 | #339 | Tragic 33.7% |
| Navajo | 0.0 /100 | #340 | Tragic 32.6% |
| Inupiat | 0.0 /100 | #341 | Tragic 32.6% |
| Yakama | 0.0 /100 | #342 | Tragic 32.3% |
| Tohono O'odham | 0.0 /100 | #343 | Tragic 31.8% |
| Yuman | 0.0 /100 | #344 | Tragic 31.3% |
| Pima | 0.0 /100 | #345 | Tragic 30.2% |
| Houma | 0.0 /100 | #346 | Tragic 28.2% |
| Yup'ik | 0.0 /100 | #347 | Tragic 25.0% |