Hispanic or Latino vs Cypriot Associate's Degree
COMPARE
Hispanic or Latino
Cypriot
Associate's Degree
Associate's Degree Comparison
Hispanics or Latinos
Cypriots
37.7%
ASSOCIATE'S DEGREE
0.0/ 100
METRIC RATING
313th/ 347
METRIC RANK
56.4%
ASSOCIATE'S DEGREE
100.0/ 100
METRIC RATING
10th/ 347
METRIC RANK
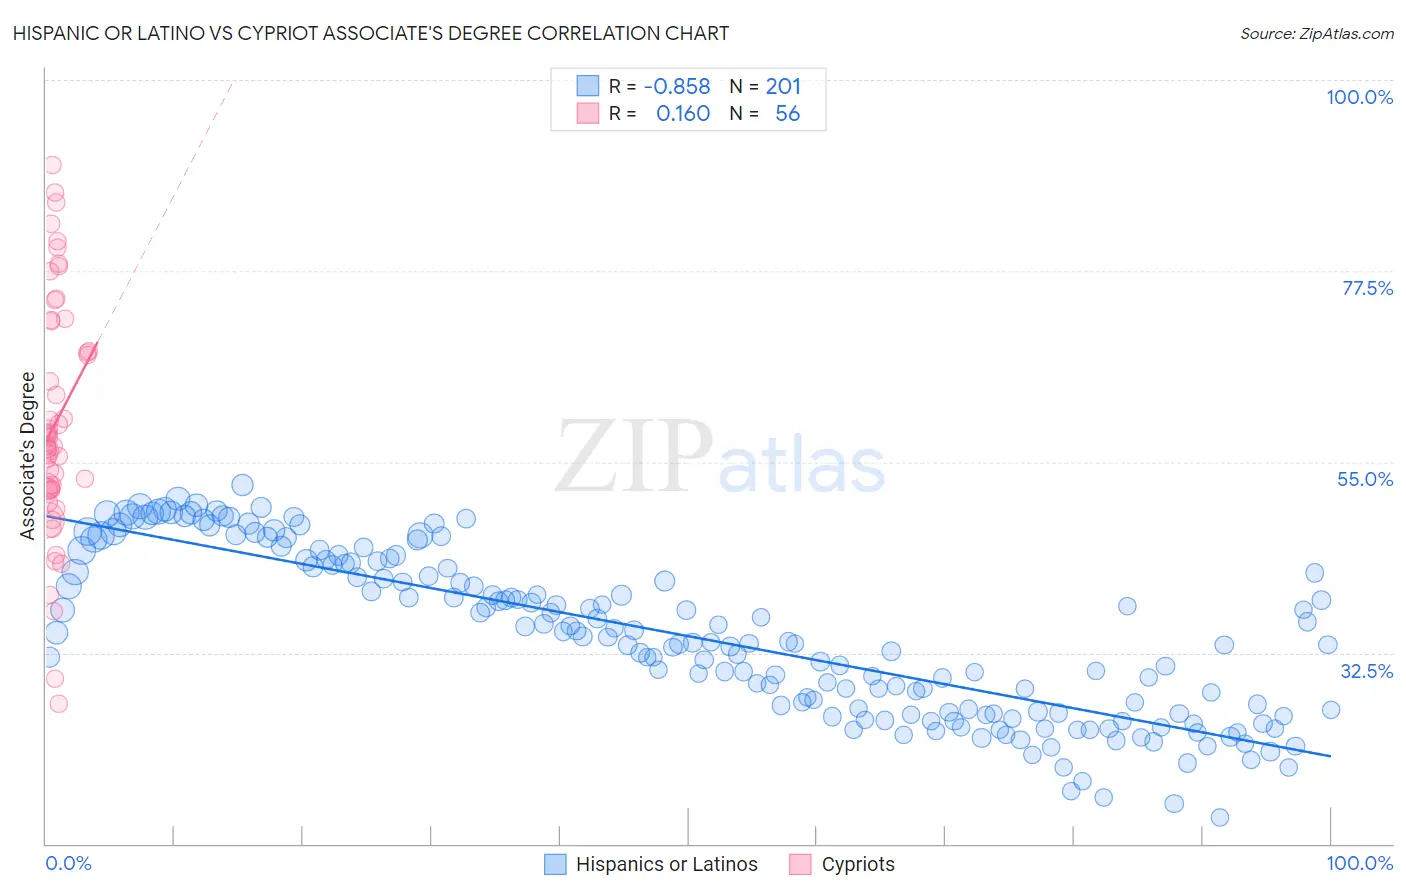
Hispanic or Latino vs Cypriot Associate's Degree Correlation Chart
The statistical analysis conducted on geographies consisting of 578,463,109 people shows a very strong negative correlation between the proportion of Hispanics or Latinos and percentage of population with at least associate's degree education in the United States with a correlation coefficient (R) of -0.858 and weighted average of 37.7%. Similarly, the statistical analysis conducted on geographies consisting of 61,863,675 people shows a poor positive correlation between the proportion of Cypriots and percentage of population with at least associate's degree education in the United States with a correlation coefficient (R) of 0.160 and weighted average of 56.4%, a difference of 49.5%.
Associate's Degree Correlation Summary
| Measurement | Hispanic or Latino | Cypriot |
| Minimum | 13.1% | 26.5% |
| Maximum | 52.2% | 90.0% |
| Range | 39.2% | 63.5% |
| Mean | 34.4% | 59.5% |
| Median | 33.7% | 56.9% |
| Interquartile 25% (IQ1) | 25.5% | 51.8% |
| Interquartile 75% (IQ3) | 42.9% | 69.7% |
| Interquartile Range (IQR) | 17.5% | 17.9% |
| Standard Deviation (Sample) | 9.6% | 14.0% |
| Standard Deviation (Population) | 9.6% | 13.9% |
Similar Demographics by Associate's Degree
Demographics Similar to Hispanics or Latinos by Associate's Degree
In terms of associate's degree, the demographic groups most similar to Hispanics or Latinos are Seminole (37.7%, a difference of 0.050%), Choctaw (37.8%, a difference of 0.15%), Immigrants from Latin America (37.9%, a difference of 0.37%), Creek (37.6%, a difference of 0.44%), and Crow (37.6%, a difference of 0.45%).
| Demographics | Rating | Rank | Associate's Degree |
| Shoshone | 0.0 /100 | #306 | Tragic 38.4% |
| Immigrants | El Salvador | 0.0 /100 | #307 | Tragic 38.4% |
| Mexican American Indians | 0.0 /100 | #308 | Tragic 38.2% |
| Immigrants | Guatemala | 0.0 /100 | #309 | Tragic 38.1% |
| Immigrants | Dominican Republic | 0.0 /100 | #310 | Tragic 37.9% |
| Immigrants | Latin America | 0.0 /100 | #311 | Tragic 37.9% |
| Choctaw | 0.0 /100 | #312 | Tragic 37.8% |
| Hispanics or Latinos | 0.0 /100 | #313 | Tragic 37.7% |
| Seminole | 0.0 /100 | #314 | Tragic 37.7% |
| Creek | 0.0 /100 | #315 | Tragic 37.6% |
| Crow | 0.0 /100 | #316 | Tragic 37.6% |
| Yaqui | 0.0 /100 | #317 | Tragic 37.6% |
| Alaska Natives | 0.0 /100 | #318 | Tragic 37.5% |
| Fijians | 0.0 /100 | #319 | Tragic 37.4% |
| Cajuns | 0.0 /100 | #320 | Tragic 37.4% |
Demographics Similar to Cypriots by Associate's Degree
In terms of associate's degree, the demographic groups most similar to Cypriots are Immigrants from Israel (56.8%, a difference of 0.72%), Immigrants from Australia (55.8%, a difference of 1.0%), Immigrants from South Central Asia (55.7%, a difference of 1.1%), Immigrants from China (55.5%, a difference of 1.7%), and Immigrants from Hong Kong (55.4%, a difference of 1.8%).
| Demographics | Rating | Rank | Associate's Degree |
| Immigrants | India | 100.0 /100 | #3 | Exceptional 58.5% |
| Immigrants | Taiwan | 100.0 /100 | #4 | Exceptional 58.4% |
| Iranians | 100.0 /100 | #5 | Exceptional 58.2% |
| Okinawans | 100.0 /100 | #6 | Exceptional 57.7% |
| Immigrants | Iran | 100.0 /100 | #7 | Exceptional 57.7% |
| Thais | 100.0 /100 | #8 | Exceptional 57.4% |
| Immigrants | Israel | 100.0 /100 | #9 | Exceptional 56.8% |
| Cypriots | 100.0 /100 | #10 | Exceptional 56.4% |
| Immigrants | Australia | 100.0 /100 | #11 | Exceptional 55.8% |
| Immigrants | South Central Asia | 100.0 /100 | #12 | Exceptional 55.7% |
| Immigrants | China | 100.0 /100 | #13 | Exceptional 55.5% |
| Immigrants | Hong Kong | 100.0 /100 | #14 | Exceptional 55.4% |
| Immigrants | Eastern Asia | 100.0 /100 | #15 | Exceptional 55.4% |
| Soviet Union | 100.0 /100 | #16 | Exceptional 55.1% |
| Eastern Europeans | 100.0 /100 | #17 | Exceptional 55.0% |