Apache vs Cypriot Associate's Degree
COMPARE
Apache
Cypriot
Associate's Degree
Associate's Degree Comparison
Apache
Cypriots
36.2%
ASSOCIATE'S DEGREE
0.0/ 100
METRIC RATING
330th/ 347
METRIC RANK
56.4%
ASSOCIATE'S DEGREE
100.0/ 100
METRIC RATING
10th/ 347
METRIC RANK
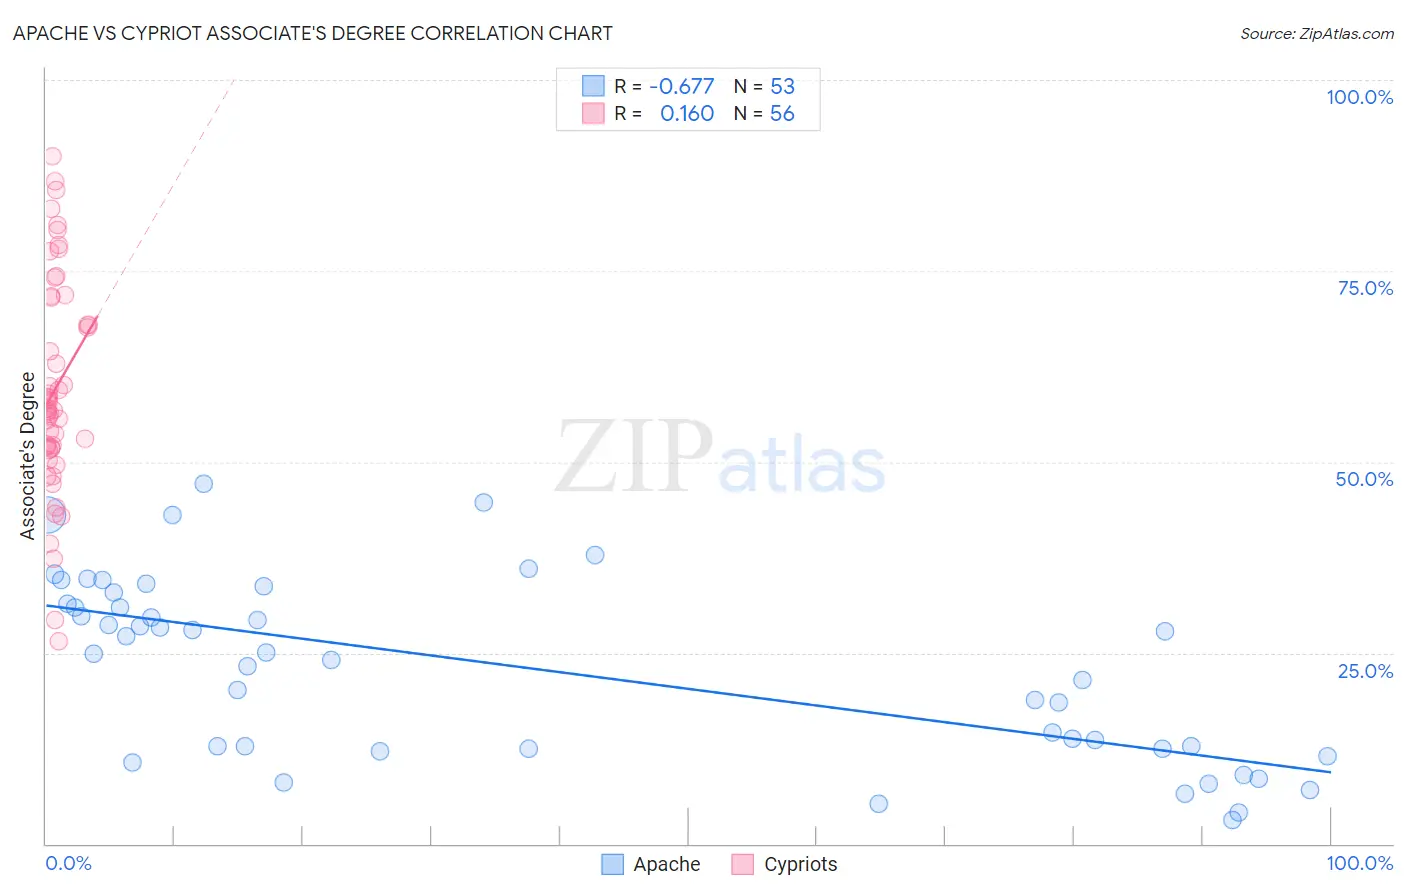
Apache vs Cypriot Associate's Degree Correlation Chart
The statistical analysis conducted on geographies consisting of 231,140,415 people shows a significant negative correlation between the proportion of Apache and percentage of population with at least associate's degree education in the United States with a correlation coefficient (R) of -0.677 and weighted average of 36.2%. Similarly, the statistical analysis conducted on geographies consisting of 61,863,675 people shows a poor positive correlation between the proportion of Cypriots and percentage of population with at least associate's degree education in the United States with a correlation coefficient (R) of 0.160 and weighted average of 56.4%, a difference of 55.5%.
Associate's Degree Correlation Summary
| Measurement | Apache | Cypriot |
| Minimum | 3.2% | 26.5% |
| Maximum | 47.2% | 90.0% |
| Range | 44.0% | 63.5% |
| Mean | 23.0% | 59.5% |
| Median | 24.9% | 56.9% |
| Interquartile 25% (IQ1) | 12.5% | 51.8% |
| Interquartile 75% (IQ3) | 32.1% | 69.7% |
| Interquartile Range (IQR) | 19.6% | 17.9% |
| Standard Deviation (Sample) | 11.9% | 14.0% |
| Standard Deviation (Population) | 11.7% | 13.9% |
Similar Demographics by Associate's Degree
Demographics Similar to Apache by Associate's Degree
In terms of associate's degree, the demographic groups most similar to Apache are Paiute (36.4%, a difference of 0.31%), Alaskan Athabascan (36.5%, a difference of 0.60%), Dutch West Indian (36.5%, a difference of 0.61%), Kiowa (36.5%, a difference of 0.63%), and Menominee (36.7%, a difference of 1.2%).
| Demographics | Rating | Rank | Associate's Degree |
| Immigrants | Cabo Verde | 0.0 /100 | #323 | Tragic 36.8% |
| Arapaho | 0.0 /100 | #324 | Tragic 36.7% |
| Menominee | 0.0 /100 | #325 | Tragic 36.7% |
| Kiowa | 0.0 /100 | #326 | Tragic 36.5% |
| Dutch West Indians | 0.0 /100 | #327 | Tragic 36.5% |
| Alaskan Athabascans | 0.0 /100 | #328 | Tragic 36.5% |
| Paiute | 0.0 /100 | #329 | Tragic 36.4% |
| Apache | 0.0 /100 | #330 | Tragic 36.2% |
| Immigrants | Azores | 0.0 /100 | #331 | Tragic 35.6% |
| Immigrants | Central America | 0.0 /100 | #332 | Tragic 35.0% |
| Mexicans | 0.0 /100 | #333 | Tragic 35.0% |
| Natives/Alaskans | 0.0 /100 | #334 | Tragic 34.9% |
| Spanish American Indians | 0.0 /100 | #335 | Tragic 34.9% |
| Hopi | 0.0 /100 | #336 | Tragic 34.6% |
| Lumbee | 0.0 /100 | #337 | Tragic 34.1% |
Demographics Similar to Cypriots by Associate's Degree
In terms of associate's degree, the demographic groups most similar to Cypriots are Immigrants from Israel (56.8%, a difference of 0.72%), Immigrants from Australia (55.8%, a difference of 1.0%), Immigrants from South Central Asia (55.7%, a difference of 1.1%), Immigrants from China (55.5%, a difference of 1.7%), and Immigrants from Hong Kong (55.4%, a difference of 1.8%).
| Demographics | Rating | Rank | Associate's Degree |
| Immigrants | India | 100.0 /100 | #3 | Exceptional 58.5% |
| Immigrants | Taiwan | 100.0 /100 | #4 | Exceptional 58.4% |
| Iranians | 100.0 /100 | #5 | Exceptional 58.2% |
| Okinawans | 100.0 /100 | #6 | Exceptional 57.7% |
| Immigrants | Iran | 100.0 /100 | #7 | Exceptional 57.7% |
| Thais | 100.0 /100 | #8 | Exceptional 57.4% |
| Immigrants | Israel | 100.0 /100 | #9 | Exceptional 56.8% |
| Cypriots | 100.0 /100 | #10 | Exceptional 56.4% |
| Immigrants | Australia | 100.0 /100 | #11 | Exceptional 55.8% |
| Immigrants | South Central Asia | 100.0 /100 | #12 | Exceptional 55.7% |
| Immigrants | China | 100.0 /100 | #13 | Exceptional 55.5% |
| Immigrants | Hong Kong | 100.0 /100 | #14 | Exceptional 55.4% |
| Immigrants | Eastern Asia | 100.0 /100 | #15 | Exceptional 55.4% |
| Soviet Union | 100.0 /100 | #16 | Exceptional 55.1% |
| Eastern Europeans | 100.0 /100 | #17 | Exceptional 55.0% |