Immigrants from Iraq vs Kenyan Associate's Degree

COMPARE

Immigrants from Iraq
Race
Ancestry
AfghanAfricanAlaska NativeAlaskan AthabascanAlbanianAleutAlsatianAmericanApacheArabArapahoArgentineanArmenianAssyrian/Chaldean/SyriacAustralianAustrianBahamianBangladeshiBarbadianBasqueBelgianBelizeanBermudanBhutaneseBlackfeetBolivianBrazilianBritishBritish West IndianBulgarianBurmeseCajunCambodianCanadianCape VerdeanCarpatho RusynCelticCentral AmericanCentral American IndianCherokeeCheyenneChickasawChileanChineseChippewaChoctawColombianColvilleComancheCosta RicanCreeCreekCroatianCrowCubanCypriotCzechCzechoslovakianDanishDelawareDominicanDutchDutch West IndianEastern EuropeanEcuadorianEgyptianEnglishEstonianEthiopianEuropeanFijianFilipinoFinnishFrenchFrench American IndianFrench CanadianGermanGerman RussianGhanaianGreekGuamanian/ChamorroGuatemalanGuyaneseHaitianHmongHonduranHopiHoumaHungarianIcelanderIndian (Asian)IndonesianInupiatIranianIraqiIrishIroquoisIsraeliItalianJamaicanJapaneseJordanianKiowaKoreanLaotianLatvianLebaneseLiberianLithuanianLumbeeLuxembourgerMacedonianMalaysianMalteseMarshalleseMenomineeMexicanMexican American IndianMongolianMoroccanNative HawaiianNavajoNepaleseNew ZealanderNicaraguanNigerianNorthern EuropeanNorwegianOkinawanOsageOttawaPaiutePakistaniPalestinianPanamanianParaguayanPennsylvania GermanPeruvianPimaPolishPortuguesePotawatomiPuebloPuerto RicanPuget Sound SalishRomanianRussianSalvadoranSamoanScandinavianScotch-IrishScottishSeminoleSenegaleseSerbianShoshoneSierra LeoneanSiouxSlavicSlovakSloveneSomaliSouth AfricanSouth AmericanSouth American IndianSoviet UnionSpaniardSpanishSpanish AmericanSpanish American IndianSri LankanSubsaharan AfricanSudaneseSwedishSwissSyrianTaiwaneseThaiTlingit-HaidaTohono O'OdhamTonganTrinidadian and TobagonianTsimshianTurkishU.S. Virgin IslanderUgandanUkrainianUruguayanUteVenezuelanVietnameseWelshWest IndianYakamaYaquiYugoslavianYumanYup'ikZimbabwean
Immigration
NonimmigrantsImmigrantsAfghanistanAfricaAlbaniaArgentinaArmeniaAsiaAustraliaAustriaBahamasBangladeshBarbadosBelarusBelgiumBelizeBoliviaBosnia and HerzegovinaBrazilBulgariaBurma/MyanmarCabo VerdeCambodiaCameroonCanadaCaribbeanCentral AmericaChileChinaColombiaCongoCosta RicaCroatiaCubaCzechoslovakiaDenmarkDominicaDominican RepublicEastern AfricaEastern AsiaEastern EuropeEcuadorEgyptEl SalvadorEnglandEritreaEthiopiaEuropeFijiFranceGermanyGhanaGreeceGrenadaGuatemalaGuyanaHaitiHondurasHong KongHungaryIndiaIndonesiaIranIraqIrelandIsraelItalyJamaicaJapanJordanKazakhstanKenyaKoreaKuwaitLaosLatin AmericaLatviaLebanonLiberiaLithuaniaMalaysiaMexicoMicronesiaMiddle AfricaMoldovaMoroccoNepalNetherlandsNicaraguaNigeriaNorth AmericaNorth MacedoniaNorthern AfricaNorthern EuropeNorwayOceaniaPakistanPanamaPeruPhilippinesPolandPortugalRomaniaRussiaSaudi ArabiaScotlandSenegalSerbiaSierra LeoneSingaporeSomaliaSouth AfricaSouth AmericaSouth Central AsiaSouth Eastern AsiaSouthern EuropeSpainSri LankaSt. Vincent and the GrenadinesSudanSwedenSwitzerlandSyriaTaiwanThailandTrinidad and TobagoTurkeyUgandaUkraineUruguayUzbekistanVenezuelaVietnamWest IndiesWestern AfricaWestern AsiaWestern EuropeYemenZaireZimbabweAzores
Kenyan
Race
Ancestry
AfghanAfricanAlaska NativeAlaskan AthabascanAlbanianAleutAlsatianAmericanApacheArabArapahoArgentineanArmenianAssyrian/Chaldean/SyriacAustralianAustrianBahamianBangladeshiBarbadianBasqueBelgianBelizeanBermudanBhutaneseBlackfeetBolivianBrazilianBritishBritish West IndianBulgarianBurmeseCajunCambodianCanadianCape VerdeanCarpatho RusynCelticCentral AmericanCentral American IndianCherokeeCheyenneChickasawChileanChineseChippewaChoctawColombianColvilleComancheCosta RicanCreeCreekCroatianCrowCubanCypriotCzechCzechoslovakianDanishDelawareDominicanDutchDutch West IndianEastern EuropeanEcuadorianEgyptianEnglishEstonianEthiopianEuropeanFijianFilipinoFinnishFrenchFrench American IndianFrench CanadianGermanGerman RussianGhanaianGreekGuamanian/ChamorroGuatemalanGuyaneseHaitianHmongHonduranHopiHoumaHungarianIcelanderIndian (Asian)IndonesianInupiatIranianIraqiIrishIroquoisIsraeliItalianJamaicanJapaneseJordanianKenyanKiowaKoreanLaotianLatvianLebaneseLiberianLithuanianLumbeeLuxembourgerMacedonianMalaysianMalteseMarshalleseMenomineeMexicanMexican American IndianMongolianMoroccanNative HawaiianNavajoNepaleseNew ZealanderNicaraguanNigerianNorthern EuropeanNorwegianOkinawanOsageOttawaPaiutePakistaniPalestinianPanamanianParaguayanPennsylvania GermanPeruvianPimaPolishPortuguesePotawatomiPuebloPuerto RicanPuget Sound SalishRomanianRussianSalvadoranSamoanScandinavianScotch-IrishScottishSeminoleSenegaleseSerbianShoshoneSierra LeoneanSiouxSlavicSlovakSloveneSomaliSouth AfricanSouth AmericanSouth American IndianSoviet UnionSpaniardSpanishSpanish AmericanSpanish American IndianSri LankanSubsaharan AfricanSudaneseSwedishSwissSyrianTaiwaneseThaiTlingit-HaidaTohono O'OdhamTonganTrinidadian and TobagonianTsimshianTurkishU.S. Virgin IslanderUgandanUkrainianUruguayanUteVenezuelanVietnameseWelshWest IndianYakamaYaquiYugoslavianYumanYup'ikZimbabwean
Immigration
NonimmigrantsImmigrantsAfghanistanAfricaAlbaniaArgentinaArmeniaAsiaAustraliaAustriaBahamasBangladeshBarbadosBelarusBelgiumBelizeBoliviaBosnia and HerzegovinaBrazilBulgariaBurma/MyanmarCabo VerdeCambodiaCameroonCanadaCaribbeanCentral AmericaChileChinaColombiaCongoCosta RicaCroatiaCubaCzechoslovakiaDenmarkDominicaDominican RepublicEastern AfricaEastern AsiaEastern EuropeEcuadorEgyptEl SalvadorEnglandEritreaEthiopiaEuropeFijiFranceGermanyGhanaGreeceGrenadaGuatemalaGuyanaHaitiHondurasHong KongHungaryIndiaIndonesiaIranIrelandIsraelItalyJamaicaJapanJordanKazakhstanKenyaKoreaKuwaitLaosLatin AmericaLatviaLebanonLiberiaLithuaniaMalaysiaMexicoMicronesiaMiddle AfricaMoldovaMoroccoNepalNetherlandsNicaraguaNigeriaNorth AmericaNorth MacedoniaNorthern AfricaNorthern EuropeNorwayOceaniaPakistanPanamaPeruPhilippinesPolandPortugalRomaniaRussiaSaudi ArabiaScotlandSenegalSerbiaSierra LeoneSingaporeSomaliaSouth AfricaSouth AmericaSouth Central AsiaSouth Eastern AsiaSouthern EuropeSpainSri LankaSt. Vincent and the GrenadinesSudanSwedenSwitzerlandSyriaTaiwanThailandTrinidad and TobagoTurkeyUgandaUkraineUruguayUzbekistanVenezuelaVietnamWest IndiesWestern AfricaWestern AsiaWestern EuropeYemenZaireZimbabweAzores
Associate's Degree
Income
Poverty
Unemployment
Labor Participation
Family Structure
Vehicle Availability
Education Level
Disability

Associate's Degree Comparison

Immigrants from Iraq

Kenyans

Average
Good
46.4%
ASSOCIATE'S DEGREE
50.3/ 100
METRIC RATING
173rd/ 347
METRIC RANK
47.1%
ASSOCIATE'S DEGREE
70.6/ 100
METRIC RATING
155th/ 347
METRIC RANK

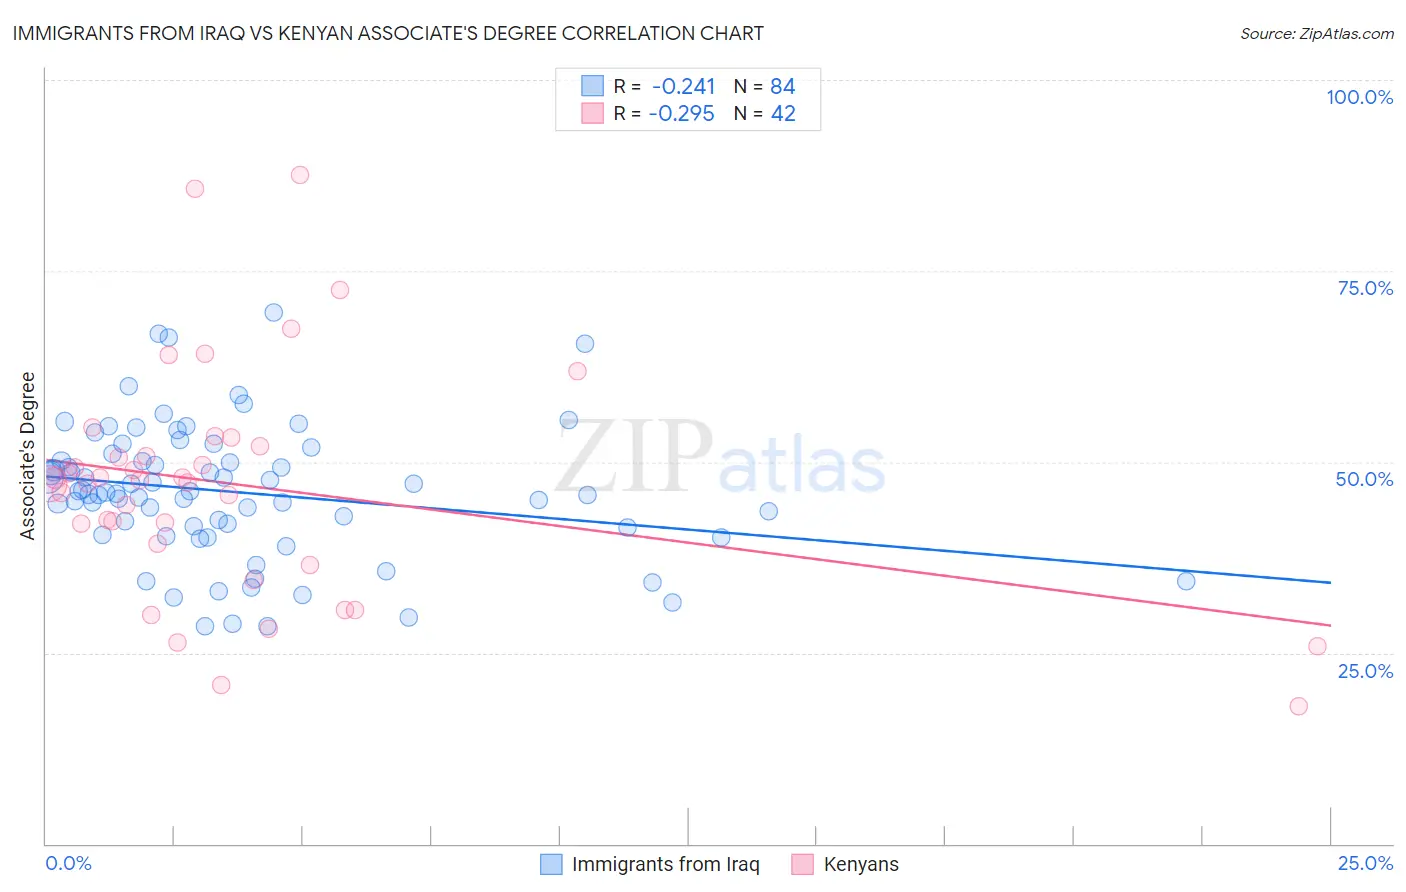
Immigrants from Iraq vs Kenyan Associate's Degree Correlation Chart

The statistical analysis conducted on geographies consisting of 194,756,177 people shows a weak negative correlation between the proportion of Immigrants from Iraq and percentage of population with at least associate's degree education in the United States with a correlation coefficient (R) of -0.241 and weighted average of 46.4%. Similarly, the statistical analysis conducted on geographies consisting of 168,244,481 people shows a weak negative correlation between the proportion of Kenyans and percentage of population with at least associate's degree education in the United States with a correlation coefficient (R) of -0.295 and weighted average of 47.1%, a difference of 1.6%.
Immigrants from Iraq vs Kenyan Associate's Degree

Associate's Degree Correlation Summary

MeasurementImmigrants from IraqKenyan
Minimum28.4%18.0%
Maximum69.6%87.6%
Range41.2%69.6%
Mean46.0%47.0%
Median46.0%47.5%
Interquartile 25% (IQ1)40.9%39.3%
Interquartile 75% (IQ3)50.6%52.1%
Interquartile Range (IQR)9.7%12.8%
Standard Deviation (Sample)8.8%15.0%
Standard Deviation (Population)8.8%14.8%

Demographics Similar to Immigrants from Iraq and Kenyans by Associate's Degree

In terms of associate's degree, the demographic groups most similar to Immigrants from Iraq are Peruvian (46.4%, a difference of 0.020%), English (46.4%, a difference of 0.020%), Basque (46.5%, a difference of 0.19%), Irish (46.5%, a difference of 0.25%), and Uruguayan (46.5%, a difference of 0.38%). Similarly, the demographic groups most similar to Kenyans are South American (47.1%, a difference of 0.010%), Sudanese (47.1%, a difference of 0.030%), Immigrants from Germany (47.1%, a difference of 0.080%), Immigrants from Kenya (47.2%, a difference of 0.13%), and Immigrants from Poland (47.1%, a difference of 0.13%).
DemographicsRating | RankAssociate's Degree
Immigrants | Kenya
72.1
/100
|
#154
Good
47.2%
Kenyans
70.6
/100
|
#155
Good
47.1%
South Americans
70.5
/100
|
#156
Good
47.1%
Sudanese
70.3
/100
|
#157
Good
47.1%
Immigrants | Germany
69.7
/100
|
#158
Good
47.1%
Immigrants | Poland
69.2
/100
|
#159
Good
47.1%
Scottish
65.4
/100
|
#160
Good
46.9%
Scandinavians
65.2
/100
|
#161
Good
46.9%
Immigrants | Africa
63.2
/100
|
#162
Good
46.8%
Somalis
62.5
/100
|
#163
Good
46.8%
Colombians
62.4
/100
|
#164
Good
46.8%
Immigrants | South America
59.9
/100
|
#165
Average
46.7%
Hungarians
59.3
/100
|
#166
Average
46.7%
Immigrants | Sierra Leone
59.2
/100
|
#167
Average
46.7%
Immigrants | Somalia
55.5
/100
|
#168
Average
46.5%
Uruguayans
55.4
/100
|
#169
Average
46.5%
Irish
53.6
/100
|
#170
Average
46.5%
Basques
52.8
/100
|
#171
Average
46.5%
Peruvians
50.5
/100
|
#172
Average
46.4%
Immigrants | Iraq
50.3
/100
|
#173
Average
46.4%
English
50.0
/100
|
#174
Average
46.4%