Immigrants from Iraq vs Cypriot 9th Grade
COMPARE
Immigrants from Iraq
Cypriot
9th Grade
9th Grade Comparison
Immigrants from Iraq
Cypriots
94.9%
9TH GRADE
47.8/ 100
METRIC RATING
177th/ 347
METRIC RANK
95.8%
9TH GRADE
99.6/ 100
METRIC RATING
67th/ 347
METRIC RANK
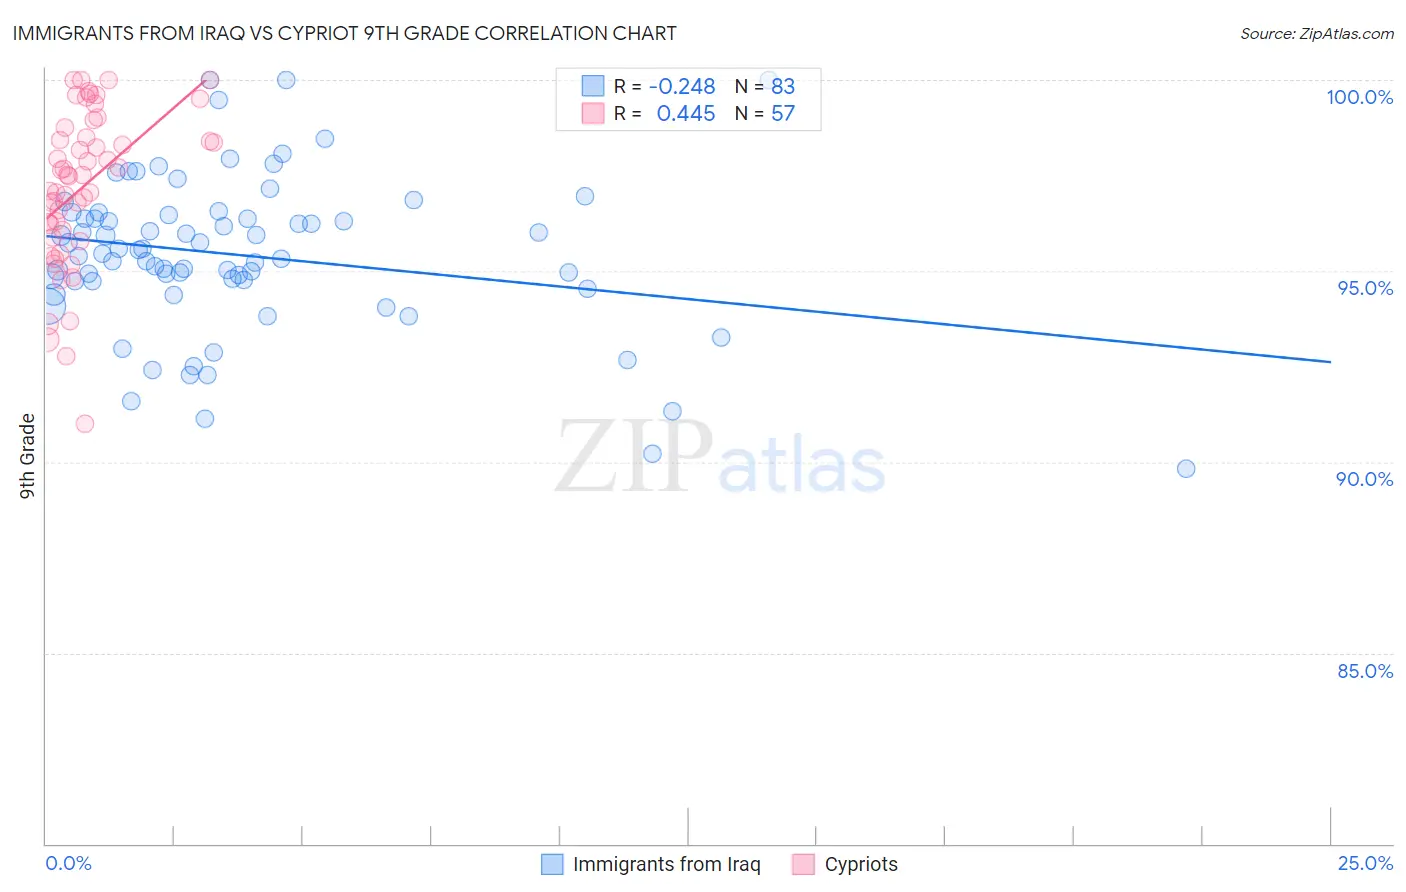
Immigrants from Iraq vs Cypriot 9th Grade Correlation Chart
The statistical analysis conducted on geographies consisting of 194,632,332 people shows a weak negative correlation between the proportion of Immigrants from Iraq and percentage of population with at least 9th grade education in the United States with a correlation coefficient (R) of -0.248 and weighted average of 94.9%. Similarly, the statistical analysis conducted on geographies consisting of 61,870,289 people shows a moderate positive correlation between the proportion of Cypriots and percentage of population with at least 9th grade education in the United States with a correlation coefficient (R) of 0.445 and weighted average of 95.8%, a difference of 1.0%.
9th Grade Correlation Summary
| Measurement | Immigrants from Iraq | Cypriot |
| Minimum | 89.8% | 91.0% |
| Maximum | 100.0% | 100.0% |
| Range | 10.2% | 9.0% |
| Mean | 95.4% | 97.2% |
| Median | 95.4% | 97.5% |
| Interquartile 25% (IQ1) | 94.7% | 96.0% |
| Interquartile 75% (IQ3) | 96.5% | 98.6% |
| Interquartile Range (IQR) | 1.7% | 2.6% |
| Standard Deviation (Sample) | 2.0% | 2.0% |
| Standard Deviation (Population) | 2.0% | 2.0% |
Similar Demographics by 9th Grade
Demographics Similar to Immigrants from Iraq by 9th Grade
In terms of 9th grade, the demographic groups most similar to Immigrants from Iraq are Brazilian (94.9%, a difference of 0.010%), Immigrants from Spain (94.9%, a difference of 0.010%), Immigrants from Poland (94.9%, a difference of 0.010%), Immigrants from Venezuela (94.9%, a difference of 0.010%), and Immigrants from Egypt (94.9%, a difference of 0.020%).
| Demographics | Rating | Rank | 9th Grade |
| Alsatians | 58.6 /100 | #170 | Average 94.9% |
| Colville | 58.5 /100 | #171 | Average 94.9% |
| Iraqis | 54.0 /100 | #172 | Average 94.9% |
| Cheyenne | 51.5 /100 | #173 | Average 94.9% |
| Immigrants | Egypt | 50.0 /100 | #174 | Average 94.9% |
| Brazilians | 49.8 /100 | #175 | Average 94.9% |
| Immigrants | Spain | 49.1 /100 | #176 | Average 94.9% |
| Immigrants | Iraq | 47.8 /100 | #177 | Average 94.9% |
| Immigrants | Poland | 46.7 /100 | #178 | Average 94.9% |
| Immigrants | Venezuela | 46.5 /100 | #179 | Average 94.9% |
| Immigrants | Uganda | 43.1 /100 | #180 | Average 94.8% |
| Sierra Leoneans | 42.7 /100 | #181 | Average 94.8% |
| Seminole | 42.5 /100 | #182 | Average 94.8% |
| Immigrants | Nepal | 39.7 /100 | #183 | Fair 94.8% |
| Argentineans | 37.6 /100 | #184 | Fair 94.8% |
Demographics Similar to Cypriots by 9th Grade
In terms of 9th grade, the demographic groups most similar to Cypriots are Immigrants from Ireland (95.8%, a difference of 0.0%), Immigrants from Lithuania (95.8%, a difference of 0.0%), Immigrants from Netherlands (95.8%, a difference of 0.010%), Immigrants from England (95.9%, a difference of 0.020%), and Immigrants from Australia (95.8%, a difference of 0.020%).
| Demographics | Rating | Rank | 9th Grade |
| Native Hawaiians | 99.8 /100 | #60 | Exceptional 95.9% |
| Sioux | 99.8 /100 | #61 | Exceptional 95.9% |
| Ukrainians | 99.7 /100 | #62 | Exceptional 95.9% |
| Canadians | 99.7 /100 | #63 | Exceptional 95.9% |
| Zimbabweans | 99.7 /100 | #64 | Exceptional 95.9% |
| Immigrants | England | 99.6 /100 | #65 | Exceptional 95.9% |
| Immigrants | Netherlands | 99.6 /100 | #66 | Exceptional 95.8% |
| Cypriots | 99.6 /100 | #67 | Exceptional 95.8% |
| Immigrants | Ireland | 99.6 /100 | #68 | Exceptional 95.8% |
| Immigrants | Lithuania | 99.6 /100 | #69 | Exceptional 95.8% |
| Immigrants | Australia | 99.5 /100 | #70 | Exceptional 95.8% |
| Immigrants | Belgium | 99.5 /100 | #71 | Exceptional 95.8% |
| Turks | 99.5 /100 | #72 | Exceptional 95.8% |
| Immigrants | Singapore | 99.5 /100 | #73 | Exceptional 95.8% |
| Thais | 99.5 /100 | #74 | Exceptional 95.8% |