Immigrants from Iraq vs Paiute Associate's Degree
COMPARE
Immigrants from Iraq
Paiute
Associate's Degree
Associate's Degree Comparison
Immigrants from Iraq
Paiute
46.4%
ASSOCIATE'S DEGREE
50.3/ 100
METRIC RATING
173rd/ 347
METRIC RANK
36.4%
ASSOCIATE'S DEGREE
0.0/ 100
METRIC RATING
329th/ 347
METRIC RANK
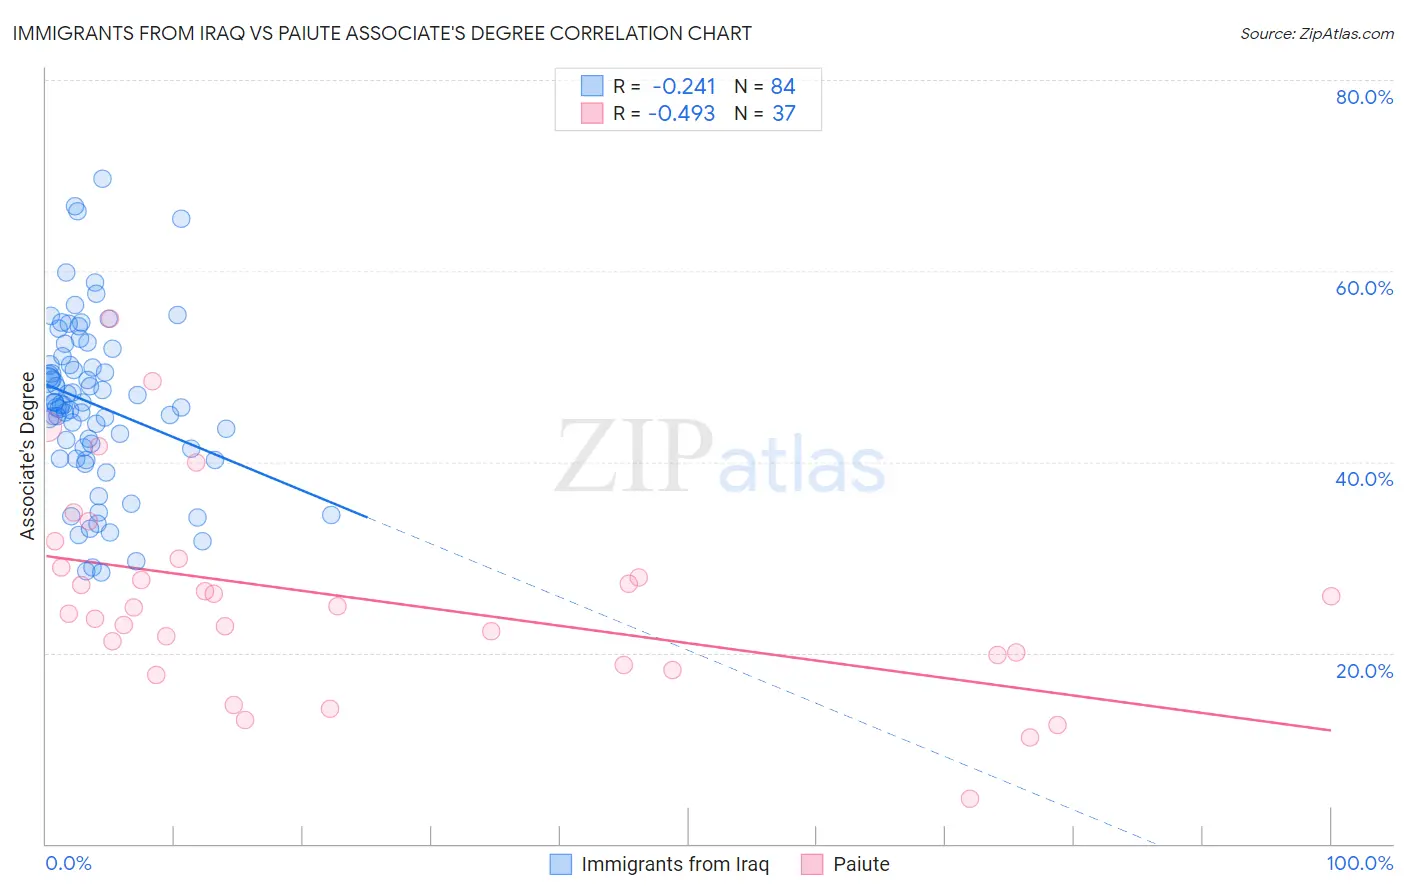
Immigrants from Iraq vs Paiute Associate's Degree Correlation Chart
The statistical analysis conducted on geographies consisting of 194,756,177 people shows a weak negative correlation between the proportion of Immigrants from Iraq and percentage of population with at least associate's degree education in the United States with a correlation coefficient (R) of -0.241 and weighted average of 46.4%. Similarly, the statistical analysis conducted on geographies consisting of 58,403,115 people shows a moderate negative correlation between the proportion of Paiute and percentage of population with at least associate's degree education in the United States with a correlation coefficient (R) of -0.493 and weighted average of 36.4%, a difference of 27.5%.
Associate's Degree Correlation Summary
| Measurement | Immigrants from Iraq | Paiute |
| Minimum | 28.4% | 4.8% |
| Maximum | 69.6% | 54.9% |
| Range | 41.2% | 50.2% |
| Mean | 46.0% | 25.6% |
| Median | 46.0% | 24.7% |
| Interquartile 25% (IQ1) | 40.9% | 19.3% |
| Interquartile 75% (IQ3) | 50.6% | 29.4% |
| Interquartile Range (IQR) | 9.7% | 10.1% |
| Standard Deviation (Sample) | 8.8% | 10.4% |
| Standard Deviation (Population) | 8.8% | 10.3% |
Similar Demographics by Associate's Degree
Demographics Similar to Immigrants from Iraq by Associate's Degree
In terms of associate's degree, the demographic groups most similar to Immigrants from Iraq are Peruvian (46.4%, a difference of 0.020%), English (46.4%, a difference of 0.020%), Belgian (46.3%, a difference of 0.10%), Finnish (46.3%, a difference of 0.13%), and Slovak (46.3%, a difference of 0.14%).
| Demographics | Rating | Rank | Associate's Degree |
| Hungarians | 59.3 /100 | #166 | Average 46.7% |
| Immigrants | Sierra Leone | 59.2 /100 | #167 | Average 46.7% |
| Immigrants | Somalia | 55.5 /100 | #168 | Average 46.5% |
| Uruguayans | 55.4 /100 | #169 | Average 46.5% |
| Irish | 53.6 /100 | #170 | Average 46.5% |
| Basques | 52.8 /100 | #171 | Average 46.5% |
| Peruvians | 50.5 /100 | #172 | Average 46.4% |
| Immigrants | Iraq | 50.3 /100 | #173 | Average 46.4% |
| English | 50.0 /100 | #174 | Average 46.4% |
| Belgians | 48.9 /100 | #175 | Average 46.3% |
| Finns | 48.5 /100 | #176 | Average 46.3% |
| Slovaks | 48.4 /100 | #177 | Average 46.3% |
| Immigrants | Bosnia and Herzegovina | 48.3 /100 | #178 | Average 46.3% |
| Sri Lankans | 47.6 /100 | #179 | Average 46.3% |
| Bermudans | 46.4 /100 | #180 | Average 46.2% |
Demographics Similar to Paiute by Associate's Degree
In terms of associate's degree, the demographic groups most similar to Paiute are Alaskan Athabascan (36.5%, a difference of 0.29%), Dutch West Indian (36.5%, a difference of 0.30%), Apache (36.2%, a difference of 0.31%), Kiowa (36.5%, a difference of 0.32%), and Menominee (36.7%, a difference of 0.88%).
| Demographics | Rating | Rank | Associate's Degree |
| Pennsylvania Germans | 0.0 /100 | #322 | Tragic 37.2% |
| Immigrants | Cabo Verde | 0.0 /100 | #323 | Tragic 36.8% |
| Arapaho | 0.0 /100 | #324 | Tragic 36.7% |
| Menominee | 0.0 /100 | #325 | Tragic 36.7% |
| Kiowa | 0.0 /100 | #326 | Tragic 36.5% |
| Dutch West Indians | 0.0 /100 | #327 | Tragic 36.5% |
| Alaskan Athabascans | 0.0 /100 | #328 | Tragic 36.5% |
| Paiute | 0.0 /100 | #329 | Tragic 36.4% |
| Apache | 0.0 /100 | #330 | Tragic 36.2% |
| Immigrants | Azores | 0.0 /100 | #331 | Tragic 35.6% |
| Immigrants | Central America | 0.0 /100 | #332 | Tragic 35.0% |
| Mexicans | 0.0 /100 | #333 | Tragic 35.0% |
| Natives/Alaskans | 0.0 /100 | #334 | Tragic 34.9% |
| Spanish American Indians | 0.0 /100 | #335 | Tragic 34.9% |
| Hopi | 0.0 /100 | #336 | Tragic 34.6% |