Immigrants from Iraq vs White/Caucasian Associate's Degree
COMPARE
Immigrants from Iraq
White/Caucasian
Associate's Degree
Associate's Degree Comparison
Immigrants from Iraq
Whites/Caucasians
46.4%
ASSOCIATE'S DEGREE
50.3/ 100
METRIC RATING
173rd/ 347
METRIC RANK
44.2%
ASSOCIATE'S DEGREE
7.5/ 100
METRIC RATING
219th/ 347
METRIC RANK
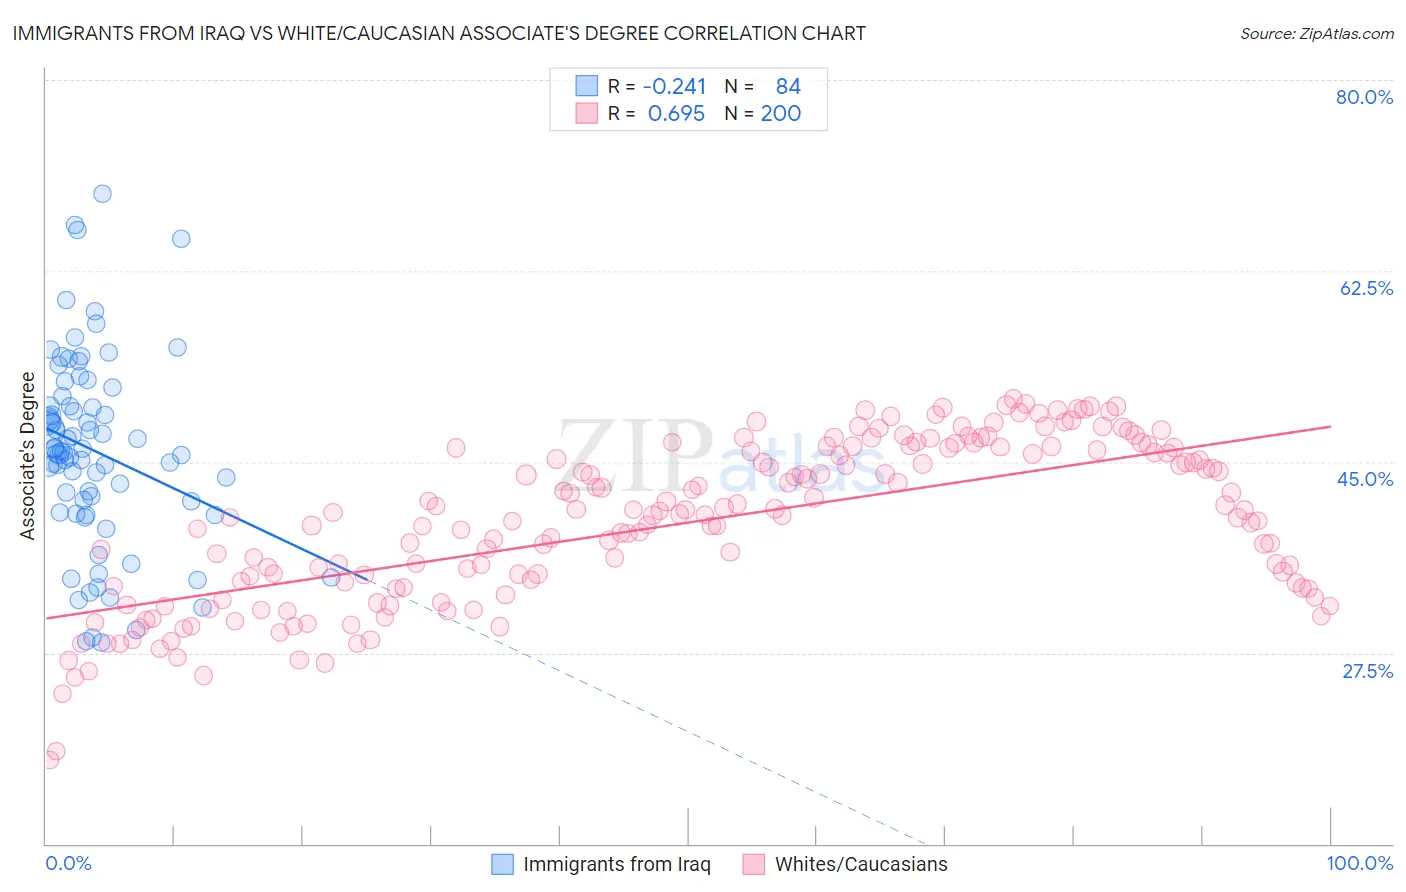
Immigrants from Iraq vs White/Caucasian Associate's Degree Correlation Chart
The statistical analysis conducted on geographies consisting of 194,756,177 people shows a weak negative correlation between the proportion of Immigrants from Iraq and percentage of population with at least associate's degree education in the United States with a correlation coefficient (R) of -0.241 and weighted average of 46.4%. Similarly, the statistical analysis conducted on geographies consisting of 584,984,374 people shows a significant positive correlation between the proportion of Whites/Caucasians and percentage of population with at least associate's degree education in the United States with a correlation coefficient (R) of 0.695 and weighted average of 44.2%, a difference of 5.0%.
Associate's Degree Correlation Summary
| Measurement | Immigrants from Iraq | White/Caucasian |
| Minimum | 28.4% | 17.7% |
| Maximum | 69.6% | 50.8% |
| Range | 41.2% | 33.1% |
| Mean | 46.0% | 39.4% |
| Median | 46.0% | 40.2% |
| Interquartile 25% (IQ1) | 40.9% | 33.5% |
| Interquartile 75% (IQ3) | 50.6% | 46.2% |
| Interquartile Range (IQR) | 9.7% | 12.6% |
| Standard Deviation (Sample) | 8.8% | 7.3% |
| Standard Deviation (Population) | 8.8% | 7.3% |
Similar Demographics by Associate's Degree
Demographics Similar to Immigrants from Iraq by Associate's Degree
In terms of associate's degree, the demographic groups most similar to Immigrants from Iraq are Peruvian (46.4%, a difference of 0.020%), English (46.4%, a difference of 0.020%), Belgian (46.3%, a difference of 0.10%), Finnish (46.3%, a difference of 0.13%), and Slovak (46.3%, a difference of 0.14%).
| Demographics | Rating | Rank | Associate's Degree |
| Hungarians | 59.3 /100 | #166 | Average 46.7% |
| Immigrants | Sierra Leone | 59.2 /100 | #167 | Average 46.7% |
| Immigrants | Somalia | 55.5 /100 | #168 | Average 46.5% |
| Uruguayans | 55.4 /100 | #169 | Average 46.5% |
| Irish | 53.6 /100 | #170 | Average 46.5% |
| Basques | 52.8 /100 | #171 | Average 46.5% |
| Peruvians | 50.5 /100 | #172 | Average 46.4% |
| Immigrants | Iraq | 50.3 /100 | #173 | Average 46.4% |
| English | 50.0 /100 | #174 | Average 46.4% |
| Belgians | 48.9 /100 | #175 | Average 46.3% |
| Finns | 48.5 /100 | #176 | Average 46.3% |
| Slovaks | 48.4 /100 | #177 | Average 46.3% |
| Immigrants | Bosnia and Herzegovina | 48.3 /100 | #178 | Average 46.3% |
| Sri Lankans | 47.6 /100 | #179 | Average 46.3% |
| Bermudans | 46.4 /100 | #180 | Average 46.2% |
Demographics Similar to Whites/Caucasians by Associate's Degree
In terms of associate's degree, the demographic groups most similar to Whites/Caucasians are Portuguese (44.1%, a difference of 0.070%), Immigrants from Western Africa (44.1%, a difference of 0.27%), Spanish (44.4%, a difference of 0.48%), Barbadian (43.9%, a difference of 0.54%), and Subsaharan African (43.9%, a difference of 0.64%).
| Demographics | Rating | Rank | Associate's Degree |
| French Canadians | 15.0 /100 | #212 | Poor 44.9% |
| Immigrants | Ghana | 14.2 /100 | #213 | Poor 44.8% |
| Immigrants | Middle Africa | 12.7 /100 | #214 | Poor 44.7% |
| Immigrants | Panama | 12.4 /100 | #215 | Poor 44.7% |
| Immigrants | Nigeria | 11.4 /100 | #216 | Poor 44.6% |
| Immigrants | Immigrants | 10.5 /100 | #217 | Poor 44.5% |
| Spanish | 9.4 /100 | #218 | Tragic 44.4% |
| Whites/Caucasians | 7.5 /100 | #219 | Tragic 44.2% |
| Portuguese | 7.2 /100 | #220 | Tragic 44.1% |
| Immigrants | Western Africa | 6.6 /100 | #221 | Tragic 44.1% |
| Barbadians | 5.8 /100 | #222 | Tragic 43.9% |
| Sub-Saharan Africans | 5.5 /100 | #223 | Tragic 43.9% |
| West Indians | 5.2 /100 | #224 | Tragic 43.8% |
| Guamanians/Chamorros | 4.8 /100 | #225 | Tragic 43.8% |
| Immigrants | Burma/Myanmar | 4.3 /100 | #226 | Tragic 43.7% |