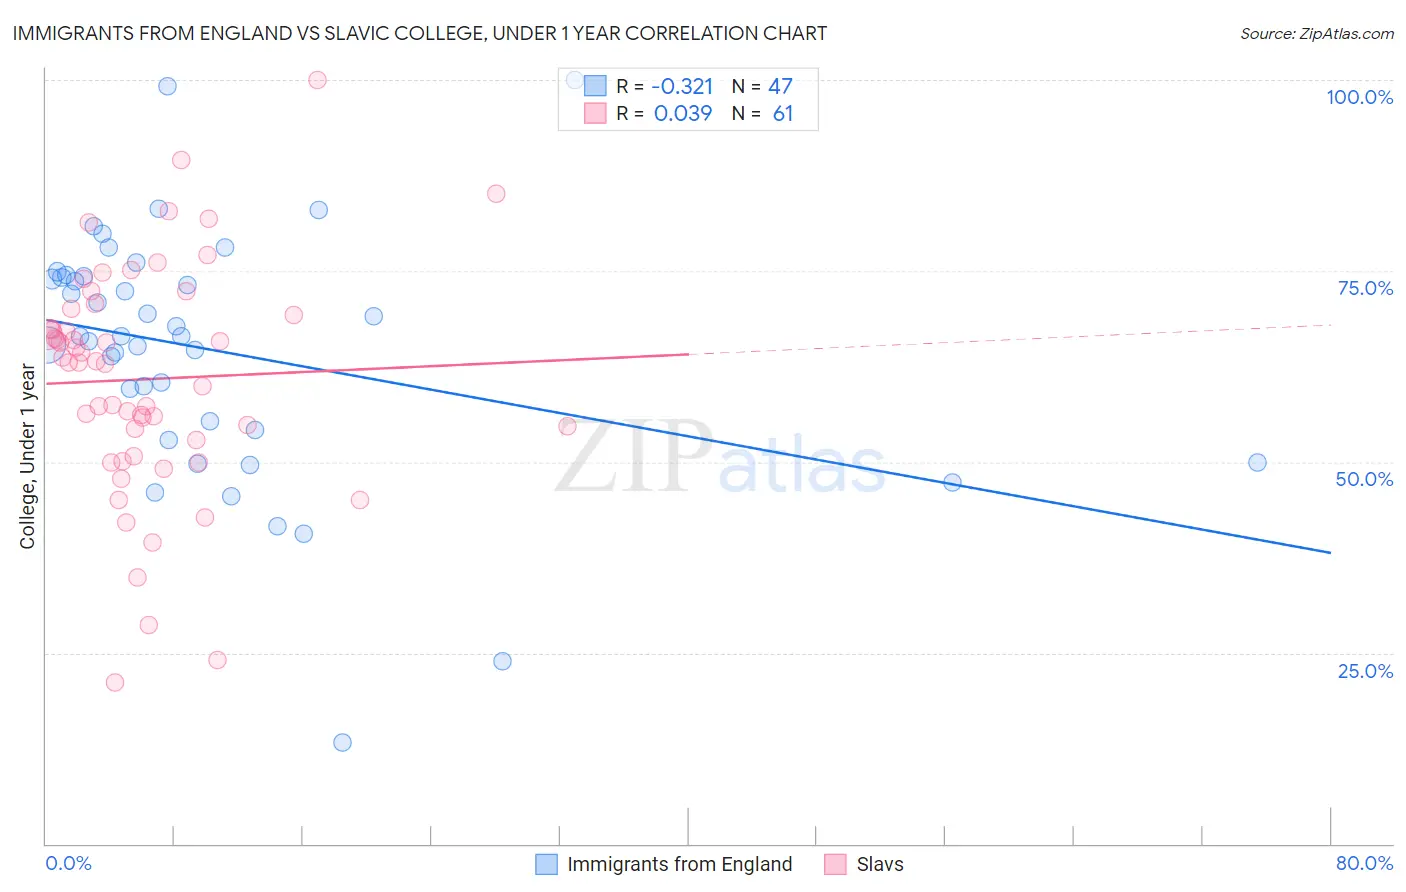
Immigrants from England vs Slavic College, Under 1 year
COMPARE
Immigrants from England
Slavic
College, Under 1 year
College, Under 1 year Comparison
Immigrants from England
Slavs
68.7%
COLLEGE, UNDER 1 YEAR
99.0/ 100
METRIC RATING
73rd/ 347
METRIC RANK
66.7%
COLLEGE, UNDER 1 YEAR
85.9/ 100
METRIC RATING
140th/ 347
METRIC RANK
Immigrants from England vs Slavic College, Under 1 year Correlation Chart
The statistical analysis conducted on geographies consisting of 391,896,166 people shows a mild negative correlation between the proportion of Immigrants from England and percentage of population with at least college, under 1 year education in the United States with a correlation coefficient (R) of -0.321 and weighted average of 68.7%. Similarly, the statistical analysis conducted on geographies consisting of 270,867,455 people shows no correlation between the proportion of Slavs and percentage of population with at least college, under 1 year education in the United States with a correlation coefficient (R) of 0.039 and weighted average of 66.7%, a difference of 3.0%.
College, Under 1 year Correlation Summary
| Measurement | Immigrants from England | Slavic |
| Minimum | 13.3% | 21.0% |
| Maximum | 100.0% | 100.0% |
| Range | 86.7% | 79.0% |
| Mean | 64.6% | 60.8% |
| Median | 66.4% | 63.0% |
| Interquartile 25% (IQ1) | 54.1% | 51.8% |
| Interquartile 75% (IQ3) | 74.3% | 69.7% |
| Interquartile Range (IQR) | 20.2% | 17.9% |
| Standard Deviation (Sample) | 16.4% | 15.1% |
| Standard Deviation (Population) | 16.3% | 14.9% |
Similar Demographics by College, Under 1 year
Demographics Similar to Immigrants from England by College, Under 1 year
In terms of college, under 1 year, the demographic groups most similar to Immigrants from England are Bolivian (68.7%, a difference of 0.040%), Swedish (68.7%, a difference of 0.060%), Immigrants from Europe (68.8%, a difference of 0.080%), Lithuanian (68.8%, a difference of 0.090%), and Immigrants from Romania (68.9%, a difference of 0.26%).
| Demographics | Rating | Rank | College, Under 1 year |
| Immigrants | North America | 99.3 /100 | #66 | Exceptional 69.0% |
| Immigrants | Zimbabwe | 99.2 /100 | #67 | Exceptional 68.9% |
| Immigrants | Indonesia | 99.2 /100 | #68 | Exceptional 68.9% |
| Immigrants | Romania | 99.2 /100 | #69 | Exceptional 68.9% |
| Lithuanians | 99.1 /100 | #70 | Exceptional 68.8% |
| Immigrants | Europe | 99.1 /100 | #71 | Exceptional 68.8% |
| Bolivians | 99.0 /100 | #72 | Exceptional 68.7% |
| Immigrants | England | 99.0 /100 | #73 | Exceptional 68.7% |
| Swedes | 98.9 /100 | #74 | Exceptional 68.7% |
| Immigrants | Western Europe | 98.6 /100 | #75 | Exceptional 68.5% |
| Laotians | 98.6 /100 | #76 | Exceptional 68.5% |
| British | 98.6 /100 | #77 | Exceptional 68.5% |
| Danes | 98.6 /100 | #78 | Exceptional 68.5% |
| Greeks | 98.6 /100 | #79 | Exceptional 68.5% |
| Immigrants | Spain | 98.5 /100 | #80 | Exceptional 68.4% |
Demographics Similar to Slavs by College, Under 1 year
In terms of college, under 1 year, the demographic groups most similar to Slavs are Venezuelan (66.7%, a difference of 0.0%), Immigrants from Afghanistan (66.7%, a difference of 0.070%), Immigrants from Italy (66.8%, a difference of 0.10%), Immigrants from Chile (66.8%, a difference of 0.15%), and Ugandan (66.8%, a difference of 0.18%).
| Demographics | Rating | Rank | College, Under 1 year |
| Immigrants | Brazil | 88.3 /100 | #133 | Excellent 66.9% |
| Iraqis | 88.0 /100 | #134 | Excellent 66.8% |
| Canadians | 87.9 /100 | #135 | Excellent 66.8% |
| Ugandans | 87.8 /100 | #136 | Excellent 66.8% |
| Immigrants | Chile | 87.4 /100 | #137 | Excellent 66.8% |
| Immigrants | Italy | 86.9 /100 | #138 | Excellent 66.8% |
| Venezuelans | 85.9 /100 | #139 | Excellent 66.7% |
| Slavs | 85.9 /100 | #140 | Excellent 66.7% |
| Immigrants | Afghanistan | 85.1 /100 | #141 | Excellent 66.7% |
| English | 82.9 /100 | #142 | Excellent 66.6% |
| Immigrants | Uganda | 82.8 /100 | #143 | Excellent 66.5% |
| Immigrants | Germany | 82.0 /100 | #144 | Excellent 66.5% |
| Immigrants | Kenya | 81.8 /100 | #145 | Excellent 66.5% |
| Kenyans | 81.7 /100 | #146 | Excellent 66.5% |
| Immigrants | Morocco | 81.7 /100 | #147 | Excellent 66.5% |