Cajun vs Slavic College, Under 1 year
COMPARE
Cajun
Slavic
College, Under 1 year
College, Under 1 year Comparison
Cajuns
Slavs
57.3%
COLLEGE, UNDER 1 YEAR
0.0/ 100
METRIC RATING
311th/ 347
METRIC RANK
66.7%
COLLEGE, UNDER 1 YEAR
85.9/ 100
METRIC RATING
140th/ 347
METRIC RANK
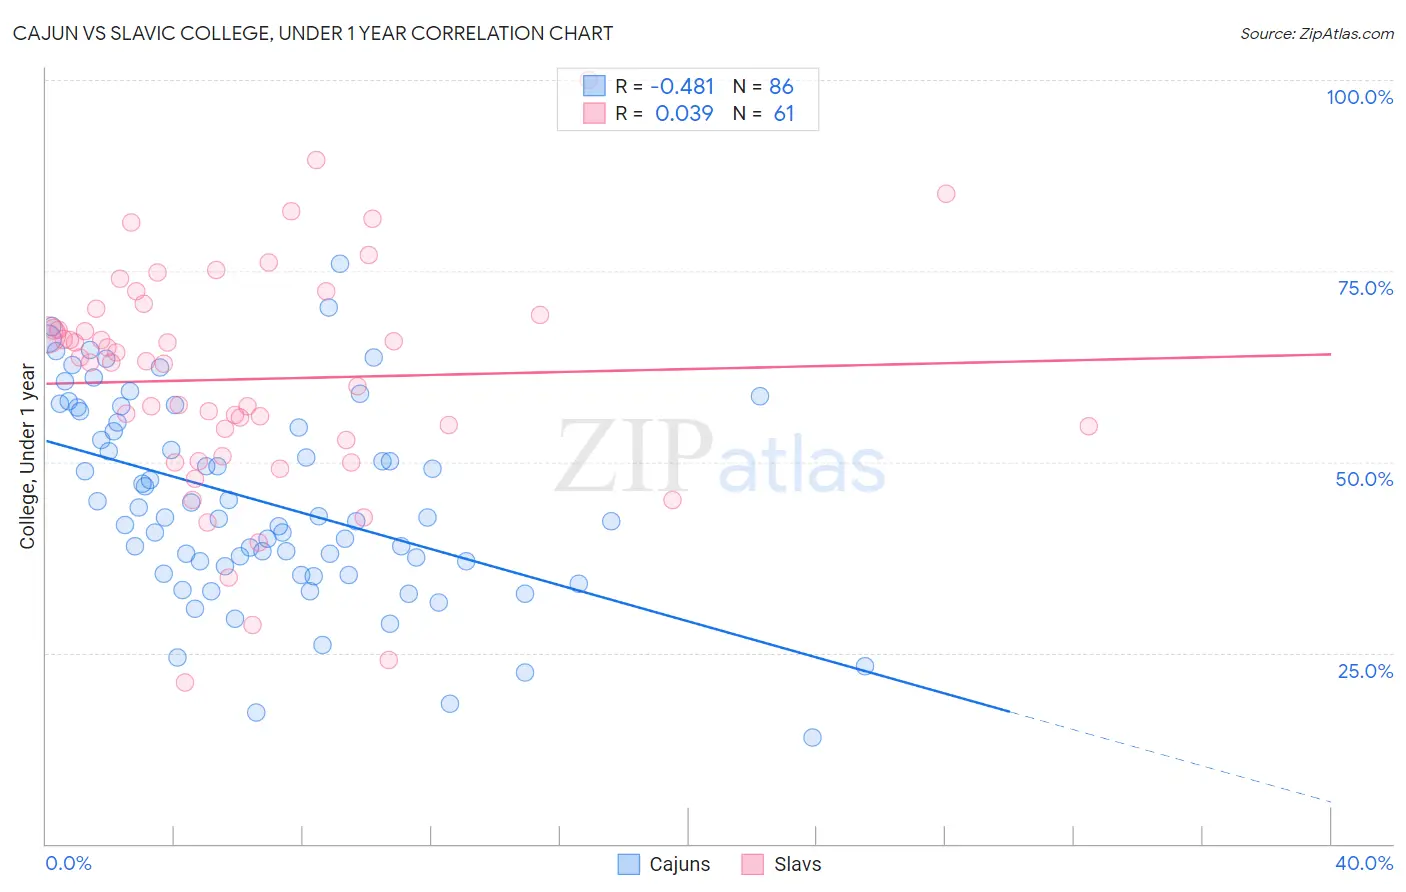
Cajun vs Slavic College, Under 1 year Correlation Chart
The statistical analysis conducted on geographies consisting of 149,713,149 people shows a moderate negative correlation between the proportion of Cajuns and percentage of population with at least college, under 1 year education in the United States with a correlation coefficient (R) of -0.481 and weighted average of 57.3%. Similarly, the statistical analysis conducted on geographies consisting of 270,867,455 people shows no correlation between the proportion of Slavs and percentage of population with at least college, under 1 year education in the United States with a correlation coefficient (R) of 0.039 and weighted average of 66.7%, a difference of 16.4%.
College, Under 1 year Correlation Summary
| Measurement | Cajun | Slavic |
| Minimum | 13.9% | 21.0% |
| Maximum | 75.9% | 100.0% |
| Range | 62.0% | 79.0% |
| Mean | 44.8% | 60.8% |
| Median | 42.7% | 63.0% |
| Interquartile 25% (IQ1) | 36.3% | 51.8% |
| Interquartile 75% (IQ3) | 55.2% | 69.7% |
| Interquartile Range (IQR) | 18.9% | 17.9% |
| Standard Deviation (Sample) | 13.0% | 15.1% |
| Standard Deviation (Population) | 12.9% | 14.9% |
Similar Demographics by College, Under 1 year
Demographics Similar to Cajuns by College, Under 1 year
In terms of college, under 1 year, the demographic groups most similar to Cajuns are Pueblo (57.4%, a difference of 0.060%), Salvadoran (57.3%, a difference of 0.070%), Dutch West Indian (57.2%, a difference of 0.31%), Hopi (57.1%, a difference of 0.42%), and Immigrants from Nicaragua (57.6%, a difference of 0.45%).
| Demographics | Rating | Rank | College, Under 1 year |
| Kiowa | 0.0 /100 | #304 | Tragic 57.8% |
| Haitians | 0.0 /100 | #305 | Tragic 57.8% |
| Immigrants | Portugal | 0.0 /100 | #306 | Tragic 57.7% |
| Fijians | 0.0 /100 | #307 | Tragic 57.7% |
| Central Americans | 0.0 /100 | #308 | Tragic 57.7% |
| Immigrants | Nicaragua | 0.0 /100 | #309 | Tragic 57.6% |
| Pueblo | 0.0 /100 | #310 | Tragic 57.4% |
| Cajuns | 0.0 /100 | #311 | Tragic 57.3% |
| Salvadorans | 0.0 /100 | #312 | Tragic 57.3% |
| Dutch West Indians | 0.0 /100 | #313 | Tragic 57.2% |
| Hopi | 0.0 /100 | #314 | Tragic 57.1% |
| Hondurans | 0.0 /100 | #315 | Tragic 57.1% |
| Menominee | 0.0 /100 | #316 | Tragic 57.0% |
| Hispanics or Latinos | 0.0 /100 | #317 | Tragic 57.0% |
| Immigrants | Haiti | 0.0 /100 | #318 | Tragic 56.9% |
Demographics Similar to Slavs by College, Under 1 year
In terms of college, under 1 year, the demographic groups most similar to Slavs are Venezuelan (66.7%, a difference of 0.0%), Immigrants from Afghanistan (66.7%, a difference of 0.070%), Immigrants from Italy (66.8%, a difference of 0.10%), Immigrants from Chile (66.8%, a difference of 0.15%), and Ugandan (66.8%, a difference of 0.18%).
| Demographics | Rating | Rank | College, Under 1 year |
| Immigrants | Brazil | 88.3 /100 | #133 | Excellent 66.9% |
| Iraqis | 88.0 /100 | #134 | Excellent 66.8% |
| Canadians | 87.9 /100 | #135 | Excellent 66.8% |
| Ugandans | 87.8 /100 | #136 | Excellent 66.8% |
| Immigrants | Chile | 87.4 /100 | #137 | Excellent 66.8% |
| Immigrants | Italy | 86.9 /100 | #138 | Excellent 66.8% |
| Venezuelans | 85.9 /100 | #139 | Excellent 66.7% |
| Slavs | 85.9 /100 | #140 | Excellent 66.7% |
| Immigrants | Afghanistan | 85.1 /100 | #141 | Excellent 66.7% |
| English | 82.9 /100 | #142 | Excellent 66.6% |
| Immigrants | Uganda | 82.8 /100 | #143 | Excellent 66.5% |
| Immigrants | Germany | 82.0 /100 | #144 | Excellent 66.5% |
| Immigrants | Kenya | 81.8 /100 | #145 | Excellent 66.5% |
| Kenyans | 81.7 /100 | #146 | Excellent 66.5% |
| Immigrants | Morocco | 81.7 /100 | #147 | Excellent 66.5% |