Immigrants from England vs Slavic Male Unemployment
COMPARE
Immigrants from England
Slavic
Male Unemployment
Male Unemployment Comparison
Immigrants from England
Slavs
5.1%
MALE UNEMPLOYMENT
90.8/ 100
METRIC RATING
110th/ 347
METRIC RANK
5.1%
MALE UNEMPLOYMENT
94.2/ 100
METRIC RATING
92nd/ 347
METRIC RANK
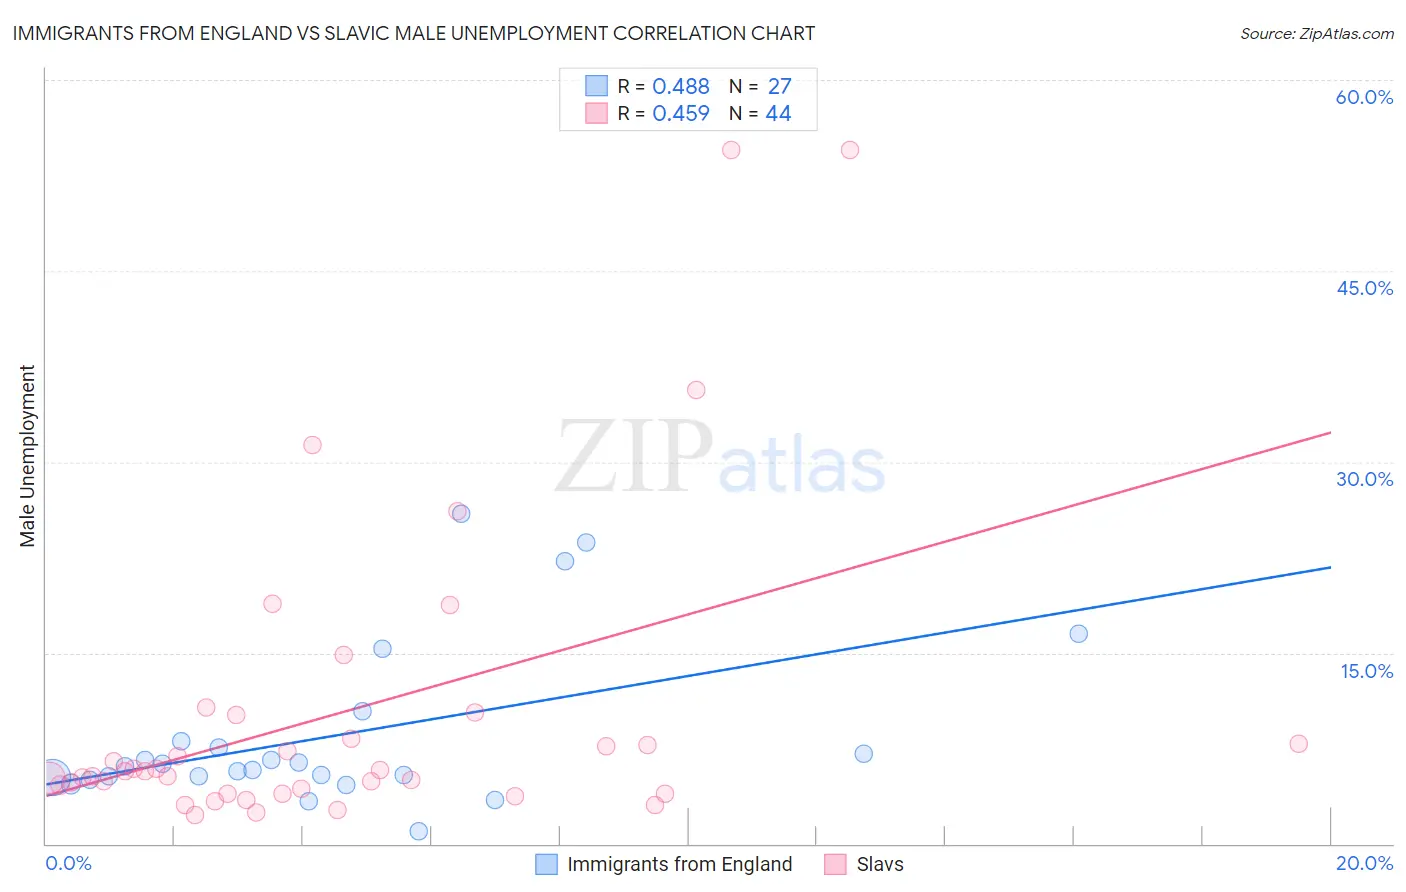
Immigrants from England vs Slavic Male Unemployment Correlation Chart
The statistical analysis conducted on geographies consisting of 390,096,041 people shows a moderate positive correlation between the proportion of Immigrants from England and unemployment rate among males in the United States with a correlation coefficient (R) of 0.488 and weighted average of 5.1%. Similarly, the statistical analysis conducted on geographies consisting of 270,129,729 people shows a moderate positive correlation between the proportion of Slavs and unemployment rate among males in the United States with a correlation coefficient (R) of 0.459 and weighted average of 5.1%, a difference of 0.77%.
Male Unemployment Correlation Summary
| Measurement | Immigrants from England | Slavic |
| Minimum | 1.0% | 2.2% |
| Maximum | 25.9% | 54.5% |
| Range | 24.9% | 52.3% |
| Mean | 8.5% | 10.3% |
| Median | 6.1% | 5.7% |
| Interquartile 25% (IQ1) | 5.2% | 4.1% |
| Interquartile 75% (IQ3) | 8.1% | 9.1% |
| Interquartile Range (IQR) | 2.9% | 5.0% |
| Standard Deviation (Sample) | 6.4% | 12.2% |
| Standard Deviation (Population) | 6.3% | 12.1% |
Demographics Similar to Immigrants from England and Slavs by Male Unemployment
In terms of male unemployment, the demographic groups most similar to Immigrants from England are Immigrants from Eastern Asia (5.1%, a difference of 0.010%), Immigrants from Pakistan (5.1%, a difference of 0.020%), Immigrants from Nicaragua (5.1%, a difference of 0.080%), Ethiopian (5.1%, a difference of 0.090%), and Immigrants from Ethiopia (5.1%, a difference of 0.13%). Similarly, the demographic groups most similar to Slavs are Immigrants from Serbia (5.1%, a difference of 0.0%), Canadian (5.1%, a difference of 0.050%), Immigrants from Turkey (5.1%, a difference of 0.060%), Italian (5.1%, a difference of 0.12%), and Asian (5.1%, a difference of 0.15%).
| Demographics | Rating | Rank | Male Unemployment |
| Immigrants | Turkey | 94.4 /100 | #91 | Exceptional 5.1% |
| Slavs | 94.2 /100 | #92 | Exceptional 5.1% |
| Immigrants | Serbia | 94.2 /100 | #93 | Exceptional 5.1% |
| Canadians | 94.1 /100 | #94 | Exceptional 5.1% |
| Italians | 93.8 /100 | #95 | Exceptional 5.1% |
| Asians | 93.7 /100 | #96 | Exceptional 5.1% |
| Immigrants | Spain | 93.4 /100 | #97 | Exceptional 5.1% |
| Immigrants | Kuwait | 93.3 /100 | #98 | Exceptional 5.1% |
| Uruguayans | 93.0 /100 | #99 | Exceptional 5.1% |
| Russians | 92.9 /100 | #100 | Exceptional 5.1% |
| German Russians | 92.7 /100 | #101 | Exceptional 5.1% |
| Immigrants | France | 92.7 /100 | #102 | Exceptional 5.1% |
| Immigrants | Jordan | 91.9 /100 | #103 | Exceptional 5.1% |
| Immigrants | Chile | 91.8 /100 | #104 | Exceptional 5.1% |
| Immigrants | Czechoslovakia | 91.7 /100 | #105 | Exceptional 5.1% |
| Immigrants | Ethiopia | 91.5 /100 | #106 | Exceptional 5.1% |
| Ethiopians | 91.3 /100 | #107 | Exceptional 5.1% |
| Immigrants | Nicaragua | 91.2 /100 | #108 | Exceptional 5.1% |
| Immigrants | Pakistan | 90.9 /100 | #109 | Exceptional 5.1% |
| Immigrants | England | 90.8 /100 | #110 | Exceptional 5.1% |
| Immigrants | Eastern Asia | 90.8 /100 | #111 | Exceptional 5.1% |