Iranian vs Slavic College, Under 1 year
COMPARE
Iranian
Slavic
College, Under 1 year
College, Under 1 year Comparison
Iranians
Slavs
74.9%
COLLEGE, UNDER 1 YEAR
100.0/ 100
METRIC RATING
2nd/ 347
METRIC RANK
66.7%
COLLEGE, UNDER 1 YEAR
85.9/ 100
METRIC RATING
140th/ 347
METRIC RANK
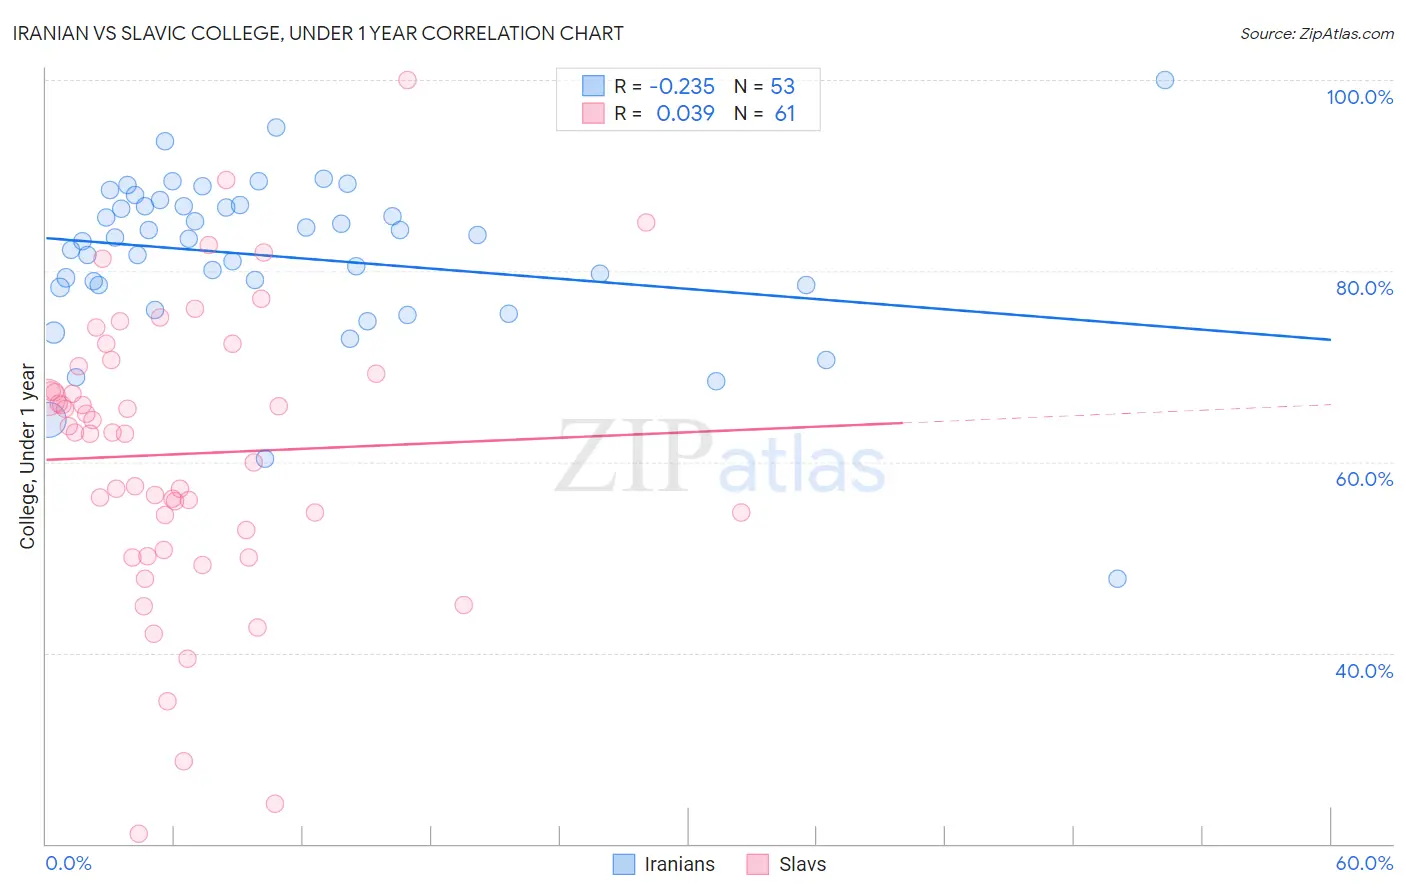
Iranian vs Slavic College, Under 1 year Correlation Chart
The statistical analysis conducted on geographies consisting of 316,900,663 people shows a weak negative correlation between the proportion of Iranians and percentage of population with at least college, under 1 year education in the United States with a correlation coefficient (R) of -0.235 and weighted average of 74.9%. Similarly, the statistical analysis conducted on geographies consisting of 270,867,455 people shows no correlation between the proportion of Slavs and percentage of population with at least college, under 1 year education in the United States with a correlation coefficient (R) of 0.039 and weighted average of 66.7%, a difference of 12.2%.
College, Under 1 year Correlation Summary
| Measurement | Iranian | Slavic |
| Minimum | 47.7% | 21.0% |
| Maximum | 100.0% | 100.0% |
| Range | 52.3% | 79.0% |
| Mean | 81.5% | 60.8% |
| Median | 83.3% | 63.0% |
| Interquartile 25% (IQ1) | 78.4% | 51.8% |
| Interquartile 75% (IQ3) | 86.9% | 69.7% |
| Interquartile Range (IQR) | 8.5% | 17.9% |
| Standard Deviation (Sample) | 8.8% | 15.1% |
| Standard Deviation (Population) | 8.8% | 14.9% |
Similar Demographics by College, Under 1 year
Demographics Similar to Iranians by College, Under 1 year
In terms of college, under 1 year, the demographic groups most similar to Iranians are Immigrants from Singapore (74.8%, a difference of 0.050%), Immigrants from India (74.4%, a difference of 0.56%), Immigrants from Iran (74.3%, a difference of 0.79%), Filipino (75.5%, a difference of 0.85%), and Immigrants from Taiwan (74.2%, a difference of 0.90%).
| Demographics | Rating | Rank | College, Under 1 year |
| Filipinos | 100.0 /100 | #1 | Exceptional 75.5% |
| Iranians | 100.0 /100 | #2 | Exceptional 74.9% |
| Immigrants | Singapore | 100.0 /100 | #3 | Exceptional 74.8% |
| Immigrants | India | 100.0 /100 | #4 | Exceptional 74.4% |
| Immigrants | Iran | 100.0 /100 | #5 | Exceptional 74.3% |
| Immigrants | Taiwan | 100.0 /100 | #6 | Exceptional 74.2% |
| Okinawans | 100.0 /100 | #7 | Exceptional 73.7% |
| Thais | 100.0 /100 | #8 | Exceptional 73.4% |
| Immigrants | Australia | 100.0 /100 | #9 | Exceptional 72.7% |
| Immigrants | Israel | 100.0 /100 | #10 | Exceptional 72.3% |
| Immigrants | South Central Asia | 100.0 /100 | #11 | Exceptional 72.1% |
| Immigrants | Sweden | 100.0 /100 | #12 | Exceptional 72.1% |
| Cypriots | 100.0 /100 | #13 | Exceptional 72.0% |
| Cambodians | 100.0 /100 | #14 | Exceptional 71.9% |
| Burmese | 100.0 /100 | #15 | Exceptional 71.9% |
Demographics Similar to Slavs by College, Under 1 year
In terms of college, under 1 year, the demographic groups most similar to Slavs are Venezuelan (66.7%, a difference of 0.0%), Immigrants from Afghanistan (66.7%, a difference of 0.070%), Immigrants from Italy (66.8%, a difference of 0.10%), Immigrants from Chile (66.8%, a difference of 0.15%), and Ugandan (66.8%, a difference of 0.18%).
| Demographics | Rating | Rank | College, Under 1 year |
| Immigrants | Brazil | 88.3 /100 | #133 | Excellent 66.9% |
| Iraqis | 88.0 /100 | #134 | Excellent 66.8% |
| Canadians | 87.9 /100 | #135 | Excellent 66.8% |
| Ugandans | 87.8 /100 | #136 | Excellent 66.8% |
| Immigrants | Chile | 87.4 /100 | #137 | Excellent 66.8% |
| Immigrants | Italy | 86.9 /100 | #138 | Excellent 66.8% |
| Venezuelans | 85.9 /100 | #139 | Excellent 66.7% |
| Slavs | 85.9 /100 | #140 | Excellent 66.7% |
| Immigrants | Afghanistan | 85.1 /100 | #141 | Excellent 66.7% |
| English | 82.9 /100 | #142 | Excellent 66.6% |
| Immigrants | Uganda | 82.8 /100 | #143 | Excellent 66.5% |
| Immigrants | Germany | 82.0 /100 | #144 | Excellent 66.5% |
| Immigrants | Kenya | 81.8 /100 | #145 | Excellent 66.5% |
| Kenyans | 81.7 /100 | #146 | Excellent 66.5% |
| Immigrants | Morocco | 81.7 /100 | #147 | Excellent 66.5% |