Immigrants from England vs Immigrants from Laos College, Under 1 year
COMPARE
Immigrants from England
Immigrants from Laos
College, Under 1 year
College, Under 1 year Comparison
Immigrants from England
Immigrants from Laos
68.7%
COLLEGE, UNDER 1 YEAR
99.0/ 100
METRIC RATING
73rd/ 347
METRIC RANK
61.3%
COLLEGE, UNDER 1 YEAR
0.3/ 100
METRIC RATING
257th/ 347
METRIC RANK
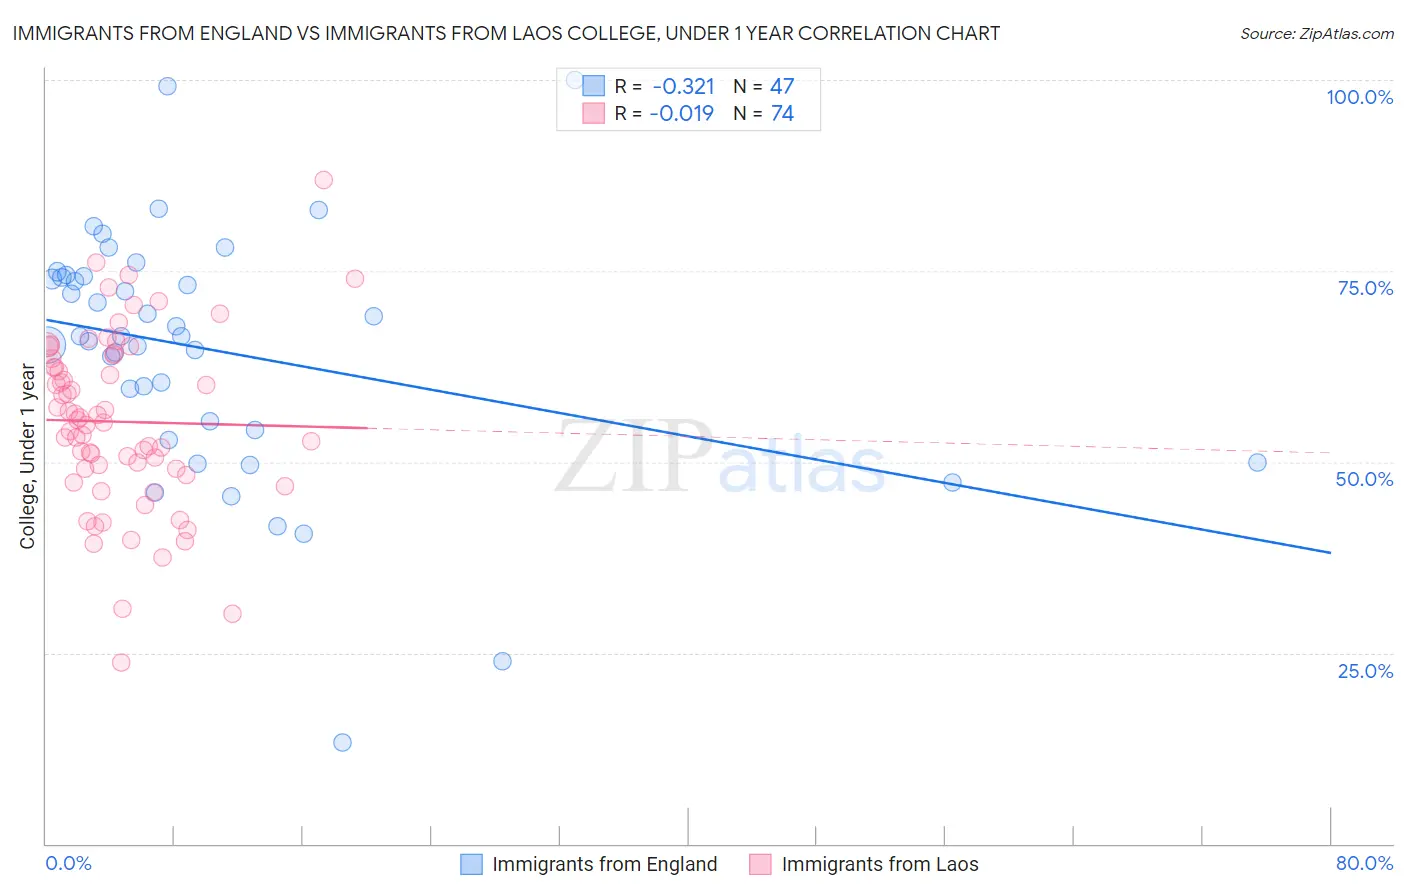
Immigrants from England vs Immigrants from Laos College, Under 1 year Correlation Chart
The statistical analysis conducted on geographies consisting of 391,896,166 people shows a mild negative correlation between the proportion of Immigrants from England and percentage of population with at least college, under 1 year education in the United States with a correlation coefficient (R) of -0.321 and weighted average of 68.7%. Similarly, the statistical analysis conducted on geographies consisting of 201,475,732 people shows no correlation between the proportion of Immigrants from Laos and percentage of population with at least college, under 1 year education in the United States with a correlation coefficient (R) of -0.019 and weighted average of 61.3%, a difference of 12.1%.
College, Under 1 year Correlation Summary
| Measurement | Immigrants from England | Immigrants from Laos |
| Minimum | 13.3% | 23.8% |
| Maximum | 100.0% | 86.9% |
| Range | 86.7% | 63.2% |
| Mean | 64.6% | 55.2% |
| Median | 66.4% | 55.3% |
| Interquartile 25% (IQ1) | 54.1% | 49.0% |
| Interquartile 75% (IQ3) | 74.3% | 63.6% |
| Interquartile Range (IQR) | 20.2% | 14.5% |
| Standard Deviation (Sample) | 16.4% | 11.4% |
| Standard Deviation (Population) | 16.3% | 11.4% |
Similar Demographics by College, Under 1 year
Demographics Similar to Immigrants from England by College, Under 1 year
In terms of college, under 1 year, the demographic groups most similar to Immigrants from England are Bolivian (68.7%, a difference of 0.040%), Swedish (68.7%, a difference of 0.060%), Immigrants from Europe (68.8%, a difference of 0.080%), Lithuanian (68.8%, a difference of 0.090%), and Immigrants from Romania (68.9%, a difference of 0.26%).
| Demographics | Rating | Rank | College, Under 1 year |
| Immigrants | North America | 99.3 /100 | #66 | Exceptional 69.0% |
| Immigrants | Zimbabwe | 99.2 /100 | #67 | Exceptional 68.9% |
| Immigrants | Indonesia | 99.2 /100 | #68 | Exceptional 68.9% |
| Immigrants | Romania | 99.2 /100 | #69 | Exceptional 68.9% |
| Lithuanians | 99.1 /100 | #70 | Exceptional 68.8% |
| Immigrants | Europe | 99.1 /100 | #71 | Exceptional 68.8% |
| Bolivians | 99.0 /100 | #72 | Exceptional 68.7% |
| Immigrants | England | 99.0 /100 | #73 | Exceptional 68.7% |
| Swedes | 98.9 /100 | #74 | Exceptional 68.7% |
| Immigrants | Western Europe | 98.6 /100 | #75 | Exceptional 68.5% |
| Laotians | 98.6 /100 | #76 | Exceptional 68.5% |
| British | 98.6 /100 | #77 | Exceptional 68.5% |
| Danes | 98.6 /100 | #78 | Exceptional 68.5% |
| Greeks | 98.6 /100 | #79 | Exceptional 68.5% |
| Immigrants | Spain | 98.5 /100 | #80 | Exceptional 68.4% |
Demographics Similar to Immigrants from Laos by College, Under 1 year
In terms of college, under 1 year, the demographic groups most similar to Immigrants from Laos are Immigrants from Bangladesh (61.3%, a difference of 0.060%), Indonesian (61.2%, a difference of 0.080%), Bangladeshi (61.4%, a difference of 0.11%), Comanche (61.4%, a difference of 0.16%), and Blackfeet (61.1%, a difference of 0.25%).
| Demographics | Rating | Rank | College, Under 1 year |
| Immigrants | Congo | 0.5 /100 | #250 | Tragic 61.7% |
| Immigrants | Micronesia | 0.5 /100 | #251 | Tragic 61.5% |
| West Indians | 0.4 /100 | #252 | Tragic 61.5% |
| Japanese | 0.4 /100 | #253 | Tragic 61.5% |
| Immigrants | Cambodia | 0.4 /100 | #254 | Tragic 61.5% |
| Comanche | 0.4 /100 | #255 | Tragic 61.4% |
| Bangladeshis | 0.4 /100 | #256 | Tragic 61.4% |
| Immigrants | Laos | 0.3 /100 | #257 | Tragic 61.3% |
| Immigrants | Bangladesh | 0.3 /100 | #258 | Tragic 61.3% |
| Indonesians | 0.3 /100 | #259 | Tragic 61.2% |
| Blackfeet | 0.3 /100 | #260 | Tragic 61.1% |
| Africans | 0.3 /100 | #261 | Tragic 61.1% |
| Barbadians | 0.2 /100 | #262 | Tragic 61.1% |
| Shoshone | 0.2 /100 | #263 | Tragic 61.1% |
| Trinidadians and Tobagonians | 0.2 /100 | #264 | Tragic 61.1% |