Immigrants from England vs Slavic Unemployment Among Women with Children Under 18 years
COMPARE
Immigrants from England
Slavic
Unemployment Among Women with Children Under 18 years
Unemployment Among Women with Children Under 18 years Comparison
Immigrants from England
Slavs
5.3%
UNEMPLOYMENT AMONG WOMEN WITH CHILDREN UNDER 18 YEARS
74.9/ 100
METRIC RATING
144th/ 347
METRIC RANK
5.2%
UNEMPLOYMENT AMONG WOMEN WITH CHILDREN UNDER 18 YEARS
89.8/ 100
METRIC RATING
107th/ 347
METRIC RANK
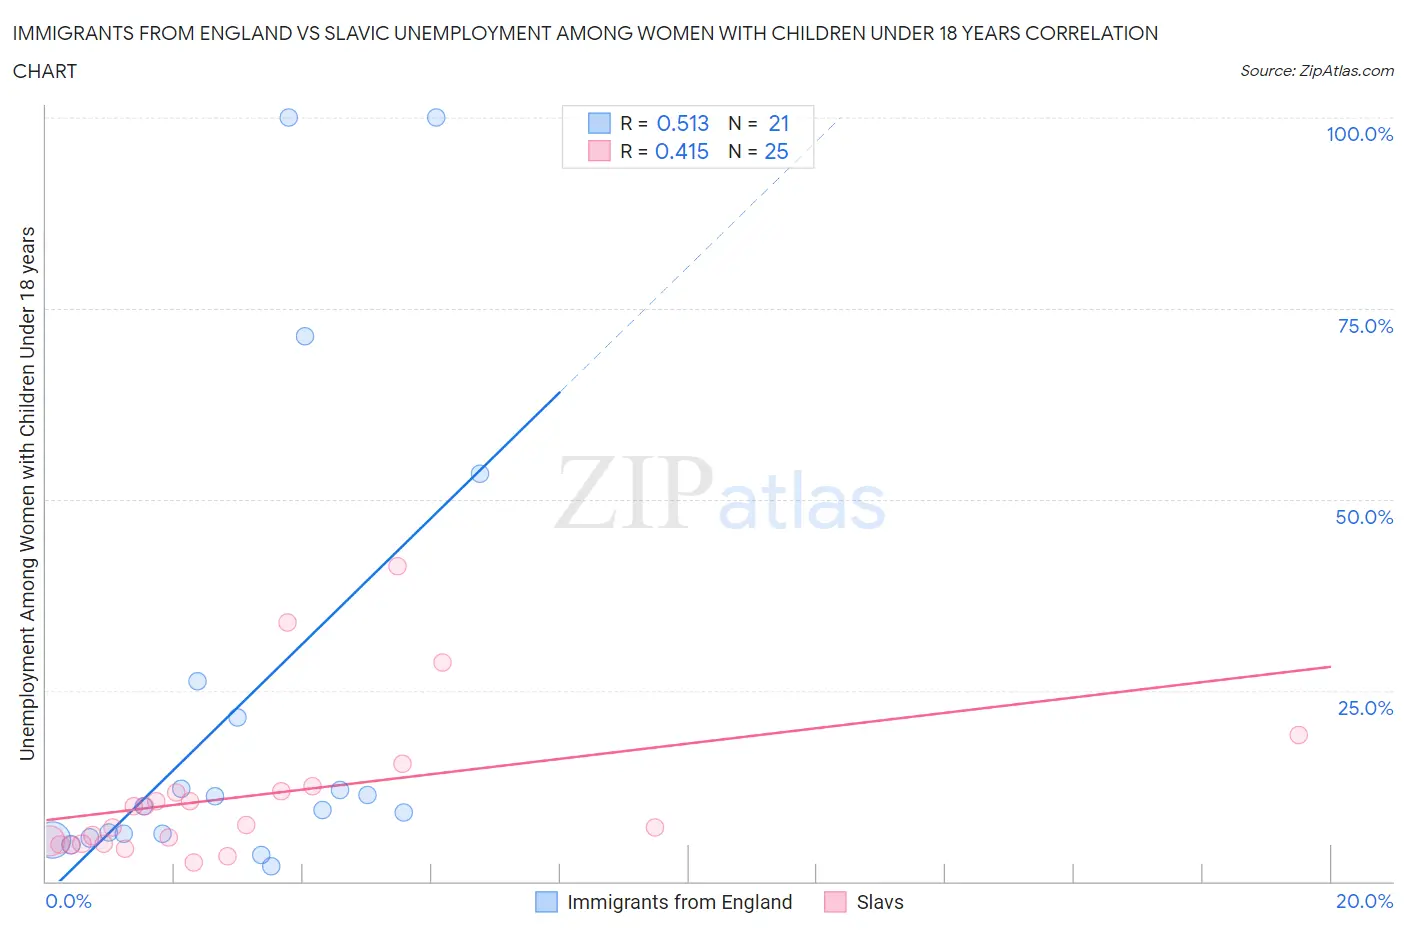
Immigrants from England vs Slavic Unemployment Among Women with Children Under 18 years Correlation Chart
The statistical analysis conducted on geographies consisting of 375,021,099 people shows a substantial positive correlation between the proportion of Immigrants from England and unemployment rate among women with children under the age of 18 in the United States with a correlation coefficient (R) of 0.513 and weighted average of 5.3%. Similarly, the statistical analysis conducted on geographies consisting of 260,877,455 people shows a moderate positive correlation between the proportion of Slavs and unemployment rate among women with children under the age of 18 in the United States with a correlation coefficient (R) of 0.415 and weighted average of 5.2%, a difference of 2.0%.
Unemployment Among Women with Children Under 18 years Correlation Summary
| Measurement | Immigrants from England | Slavic |
| Minimum | 2.0% | 2.4% |
| Maximum | 100.0% | 41.3% |
| Range | 98.0% | 38.9% |
| Mean | 23.2% | 11.3% |
| Median | 9.8% | 7.3% |
| Interquartile 25% (IQ1) | 5.9% | 4.9% |
| Interquartile 75% (IQ3) | 23.8% | 12.1% |
| Interquartile Range (IQR) | 17.9% | 7.2% |
| Standard Deviation (Sample) | 30.7% | 9.8% |
| Standard Deviation (Population) | 29.9% | 9.6% |
Similar Demographics by Unemployment Among Women with Children Under 18 years
Demographics Similar to Immigrants from England by Unemployment Among Women with Children Under 18 years
In terms of unemployment among women with children under 18 years, the demographic groups most similar to Immigrants from England are Chilean (5.3%, a difference of 0.010%), Immigrants from Venezuela (5.3%, a difference of 0.050%), Immigrants from Egypt (5.3%, a difference of 0.090%), Venezuelan (5.3%, a difference of 0.11%), and Immigrants from Norway (5.3%, a difference of 0.13%).
| Demographics | Rating | Rank | Unemployment Among Women with Children Under 18 years |
| Jordanians | 78.8 /100 | #137 | Good 5.3% |
| Argentineans | 78.8 /100 | #138 | Good 5.3% |
| Immigrants | Ukraine | 78.5 /100 | #139 | Good 5.3% |
| Immigrants | Norway | 76.2 /100 | #140 | Good 5.3% |
| Venezuelans | 76.0 /100 | #141 | Good 5.3% |
| Immigrants | Venezuela | 75.4 /100 | #142 | Good 5.3% |
| Chileans | 75.0 /100 | #143 | Good 5.3% |
| Immigrants | England | 74.9 /100 | #144 | Good 5.3% |
| Immigrants | Egypt | 74.0 /100 | #145 | Good 5.3% |
| Immigrants | Belarus | 73.4 /100 | #146 | Good 5.3% |
| Bangladeshis | 73.2 /100 | #147 | Good 5.3% |
| Immigrants | Western Europe | 72.8 /100 | #148 | Good 5.4% |
| Immigrants | Kenya | 72.2 /100 | #149 | Good 5.4% |
| Immigrants | Argentina | 71.7 /100 | #150 | Good 5.4% |
| Immigrants | Iran | 71.1 /100 | #151 | Good 5.4% |
Demographics Similar to Slavs by Unemployment Among Women with Children Under 18 years
In terms of unemployment among women with children under 18 years, the demographic groups most similar to Slavs are Pakistani (5.2%, a difference of 0.010%), Immigrants from France (5.2%, a difference of 0.030%), Iranian (5.2%, a difference of 0.040%), Immigrants from Switzerland (5.2%, a difference of 0.050%), and Sri Lankan (5.2%, a difference of 0.090%).
| Demographics | Rating | Rank | Unemployment Among Women with Children Under 18 years |
| Immigrants | Greece | 91.4 /100 | #100 | Exceptional 5.2% |
| Immigrants | Netherlands | 91.0 /100 | #101 | Exceptional 5.2% |
| Immigrants | Cuba | 90.9 /100 | #102 | Exceptional 5.2% |
| Sri Lankans | 90.3 /100 | #103 | Exceptional 5.2% |
| Immigrants | Switzerland | 90.1 /100 | #104 | Exceptional 5.2% |
| Immigrants | France | 90.0 /100 | #105 | Excellent 5.2% |
| Pakistanis | 89.9 /100 | #106 | Excellent 5.2% |
| Slavs | 89.8 /100 | #107 | Excellent 5.2% |
| Iranians | 89.7 /100 | #108 | Excellent 5.2% |
| Immigrants | Russia | 89.0 /100 | #109 | Excellent 5.2% |
| Immigrants | Czechoslovakia | 88.9 /100 | #110 | Excellent 5.2% |
| French Canadians | 88.9 /100 | #111 | Excellent 5.2% |
| Immigrants | Eastern Europe | 88.5 /100 | #112 | Excellent 5.2% |
| French | 88.4 /100 | #113 | Excellent 5.2% |
| Kenyans | 88.2 /100 | #114 | Excellent 5.3% |