Immigrants from England vs Dominican College, Under 1 year
COMPARE
Immigrants from England
Dominican
College, Under 1 year
College, Under 1 year Comparison
Immigrants from England
Dominicans
68.7%
COLLEGE, UNDER 1 YEAR
99.0/ 100
METRIC RATING
73rd/ 347
METRIC RANK
55.5%
COLLEGE, UNDER 1 YEAR
0.0/ 100
METRIC RATING
331st/ 347
METRIC RANK
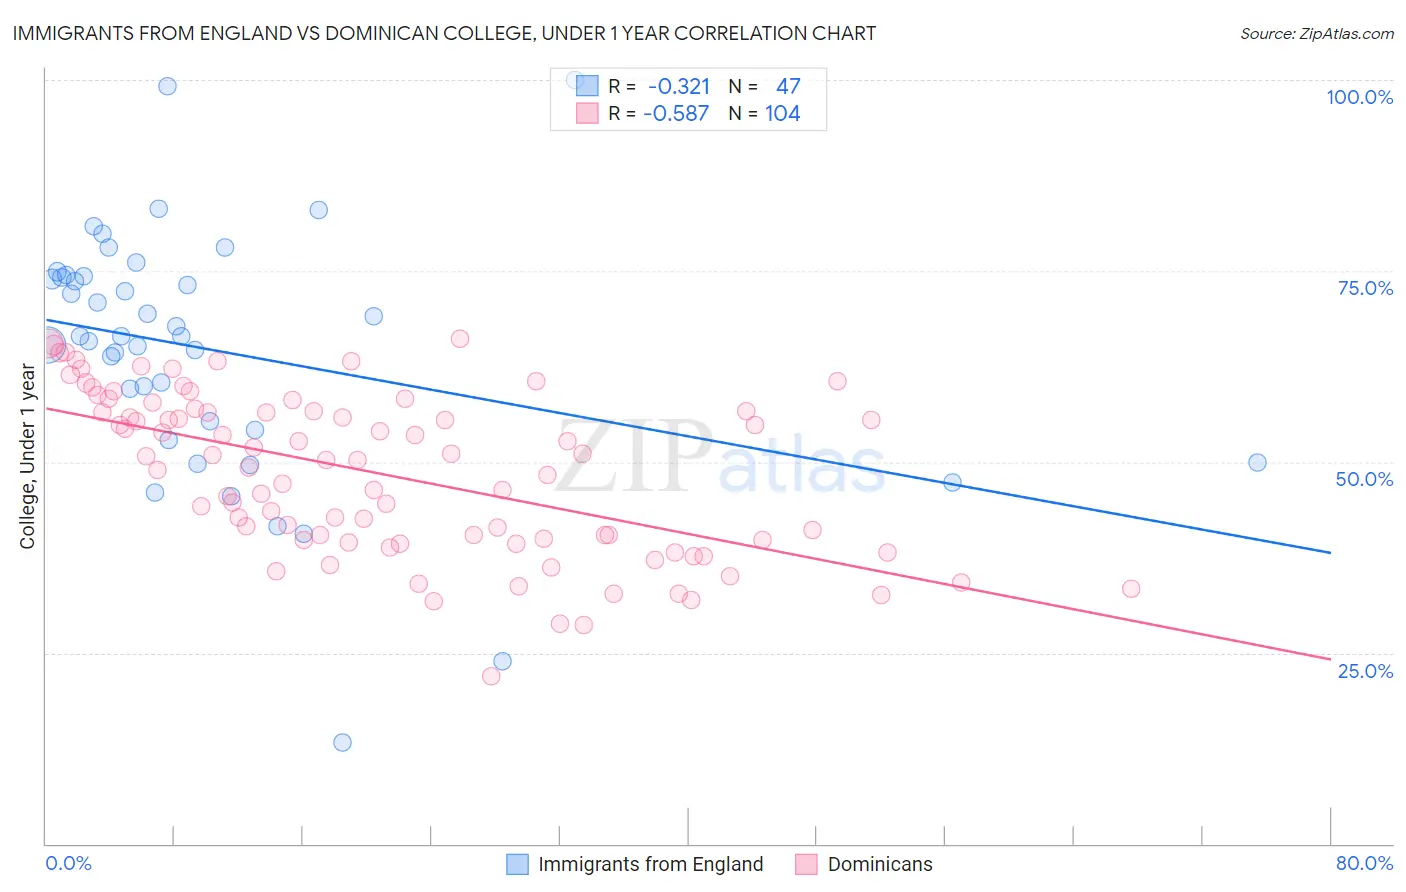
Immigrants from England vs Dominican College, Under 1 year Correlation Chart
The statistical analysis conducted on geographies consisting of 391,896,166 people shows a mild negative correlation between the proportion of Immigrants from England and percentage of population with at least college, under 1 year education in the United States with a correlation coefficient (R) of -0.321 and weighted average of 68.7%. Similarly, the statistical analysis conducted on geographies consisting of 355,140,552 people shows a substantial negative correlation between the proportion of Dominicans and percentage of population with at least college, under 1 year education in the United States with a correlation coefficient (R) of -0.587 and weighted average of 55.5%, a difference of 23.8%.
College, Under 1 year Correlation Summary
| Measurement | Immigrants from England | Dominican |
| Minimum | 13.3% | 22.0% |
| Maximum | 100.0% | 66.2% |
| Range | 86.7% | 44.2% |
| Mean | 64.6% | 48.5% |
| Median | 66.4% | 50.2% |
| Interquartile 25% (IQ1) | 54.1% | 39.7% |
| Interquartile 75% (IQ3) | 74.3% | 56.6% |
| Interquartile Range (IQR) | 20.2% | 16.9% |
| Standard Deviation (Sample) | 16.4% | 10.5% |
| Standard Deviation (Population) | 16.3% | 10.4% |
Similar Demographics by College, Under 1 year
Demographics Similar to Immigrants from England by College, Under 1 year
In terms of college, under 1 year, the demographic groups most similar to Immigrants from England are Bolivian (68.7%, a difference of 0.040%), Swedish (68.7%, a difference of 0.060%), Immigrants from Europe (68.8%, a difference of 0.080%), Lithuanian (68.8%, a difference of 0.090%), and Immigrants from Romania (68.9%, a difference of 0.26%).
| Demographics | Rating | Rank | College, Under 1 year |
| Immigrants | North America | 99.3 /100 | #66 | Exceptional 69.0% |
| Immigrants | Zimbabwe | 99.2 /100 | #67 | Exceptional 68.9% |
| Immigrants | Indonesia | 99.2 /100 | #68 | Exceptional 68.9% |
| Immigrants | Romania | 99.2 /100 | #69 | Exceptional 68.9% |
| Lithuanians | 99.1 /100 | #70 | Exceptional 68.8% |
| Immigrants | Europe | 99.1 /100 | #71 | Exceptional 68.8% |
| Bolivians | 99.0 /100 | #72 | Exceptional 68.7% |
| Immigrants | England | 99.0 /100 | #73 | Exceptional 68.7% |
| Swedes | 98.9 /100 | #74 | Exceptional 68.7% |
| Immigrants | Western Europe | 98.6 /100 | #75 | Exceptional 68.5% |
| Laotians | 98.6 /100 | #76 | Exceptional 68.5% |
| British | 98.6 /100 | #77 | Exceptional 68.5% |
| Danes | 98.6 /100 | #78 | Exceptional 68.5% |
| Greeks | 98.6 /100 | #79 | Exceptional 68.5% |
| Immigrants | Spain | 98.5 /100 | #80 | Exceptional 68.4% |
Demographics Similar to Dominicans by College, Under 1 year
In terms of college, under 1 year, the demographic groups most similar to Dominicans are Mexican (55.6%, a difference of 0.26%), Immigrants from Cuba (55.7%, a difference of 0.40%), Immigrants from Yemen (55.3%, a difference of 0.41%), Yuman (55.1%, a difference of 0.73%), and Cape Verdean (56.0%, a difference of 1.0%).
| Demographics | Rating | Rank | College, Under 1 year |
| Immigrants | El Salvador | 0.0 /100 | #324 | Tragic 56.4% |
| Immigrants | Latin America | 0.0 /100 | #325 | Tragic 56.3% |
| Navajo | 0.0 /100 | #326 | Tragic 56.3% |
| Immigrants | Guatemala | 0.0 /100 | #327 | Tragic 56.2% |
| Cape Verdeans | 0.0 /100 | #328 | Tragic 56.0% |
| Immigrants | Cuba | 0.0 /100 | #329 | Tragic 55.7% |
| Mexicans | 0.0 /100 | #330 | Tragic 55.6% |
| Dominicans | 0.0 /100 | #331 | Tragic 55.5% |
| Immigrants | Yemen | 0.0 /100 | #332 | Tragic 55.3% |
| Yuman | 0.0 /100 | #333 | Tragic 55.1% |
| Immigrants | Azores | 0.0 /100 | #334 | Tragic 54.7% |
| Inupiat | 0.0 /100 | #335 | Tragic 54.6% |
| Pennsylvania Germans | 0.0 /100 | #336 | Tragic 54.5% |
| Immigrants | Central America | 0.0 /100 | #337 | Tragic 54.4% |
| Lumbee | 0.0 /100 | #338 | Tragic 54.2% |