Immigrants from England vs Immigrants from India College, Under 1 year
COMPARE
Immigrants from England
Immigrants from India
College, Under 1 year
College, Under 1 year Comparison
Immigrants from England
Immigrants from India
68.7%
COLLEGE, UNDER 1 YEAR
99.0/ 100
METRIC RATING
73rd/ 347
METRIC RANK
74.4%
COLLEGE, UNDER 1 YEAR
100.0/ 100
METRIC RATING
4th/ 347
METRIC RANK
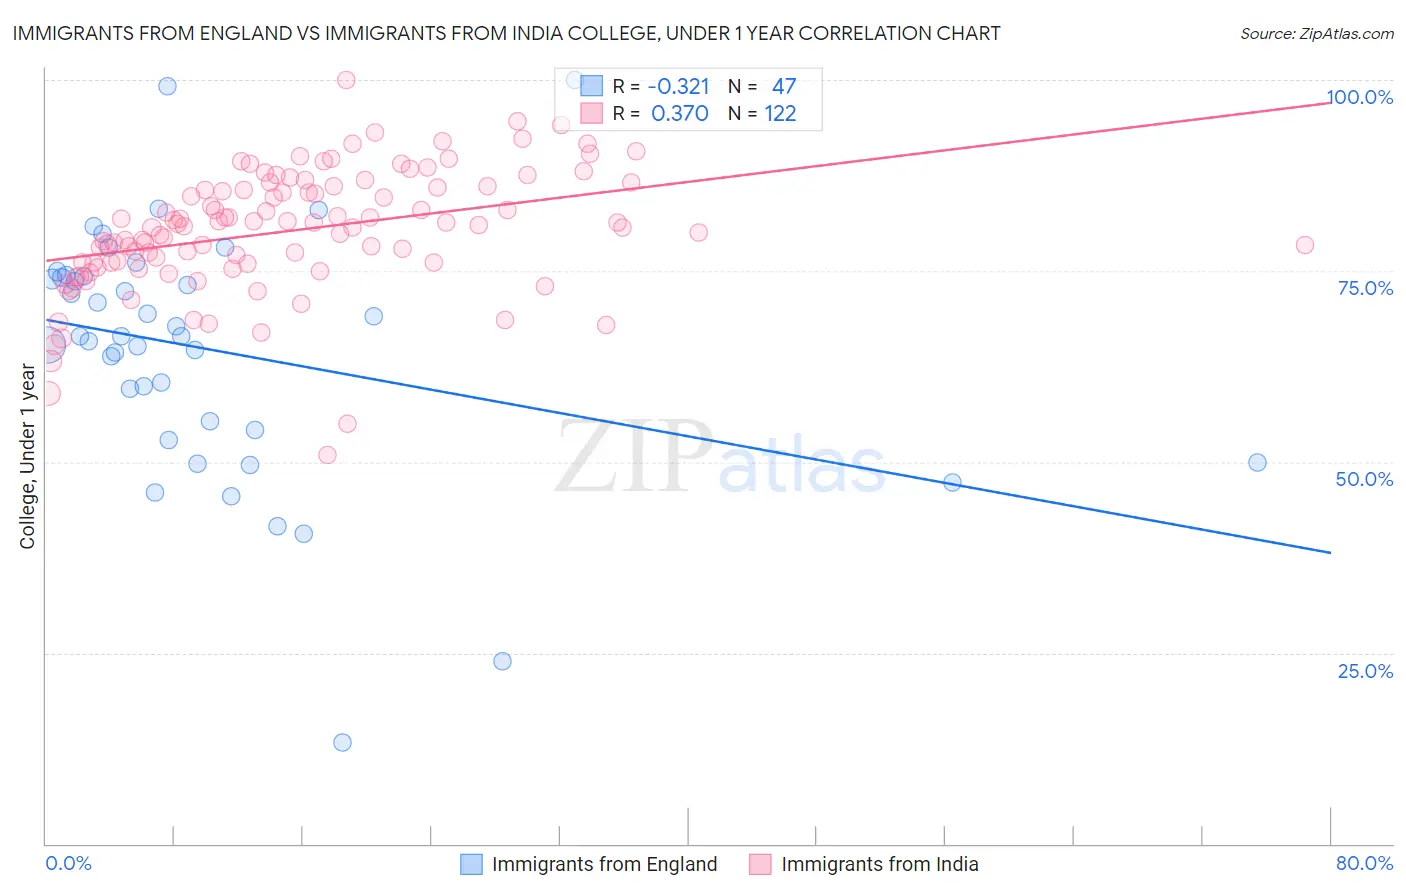
Immigrants from England vs Immigrants from India College, Under 1 year Correlation Chart
The statistical analysis conducted on geographies consisting of 391,896,166 people shows a mild negative correlation between the proportion of Immigrants from England and percentage of population with at least college, under 1 year education in the United States with a correlation coefficient (R) of -0.321 and weighted average of 68.7%. Similarly, the statistical analysis conducted on geographies consisting of 434,101,057 people shows a mild positive correlation between the proportion of Immigrants from India and percentage of population with at least college, under 1 year education in the United States with a correlation coefficient (R) of 0.370 and weighted average of 74.4%, a difference of 8.3%.
College, Under 1 year Correlation Summary
| Measurement | Immigrants from England | Immigrants from India |
| Minimum | 13.3% | 50.9% |
| Maximum | 100.0% | 100.0% |
| Range | 86.7% | 49.1% |
| Mean | 64.6% | 80.2% |
| Median | 66.4% | 80.9% |
| Interquartile 25% (IQ1) | 54.1% | 76.0% |
| Interquartile 75% (IQ3) | 74.3% | 85.9% |
| Interquartile Range (IQR) | 20.2% | 9.9% |
| Standard Deviation (Sample) | 16.4% | 8.0% |
| Standard Deviation (Population) | 16.3% | 8.0% |
Similar Demographics by College, Under 1 year
Demographics Similar to Immigrants from England by College, Under 1 year
In terms of college, under 1 year, the demographic groups most similar to Immigrants from England are Bolivian (68.7%, a difference of 0.040%), Swedish (68.7%, a difference of 0.060%), Immigrants from Europe (68.8%, a difference of 0.080%), Lithuanian (68.8%, a difference of 0.090%), and Immigrants from Romania (68.9%, a difference of 0.26%).
| Demographics | Rating | Rank | College, Under 1 year |
| Immigrants | North America | 99.3 /100 | #66 | Exceptional 69.0% |
| Immigrants | Zimbabwe | 99.2 /100 | #67 | Exceptional 68.9% |
| Immigrants | Indonesia | 99.2 /100 | #68 | Exceptional 68.9% |
| Immigrants | Romania | 99.2 /100 | #69 | Exceptional 68.9% |
| Lithuanians | 99.1 /100 | #70 | Exceptional 68.8% |
| Immigrants | Europe | 99.1 /100 | #71 | Exceptional 68.8% |
| Bolivians | 99.0 /100 | #72 | Exceptional 68.7% |
| Immigrants | England | 99.0 /100 | #73 | Exceptional 68.7% |
| Swedes | 98.9 /100 | #74 | Exceptional 68.7% |
| Immigrants | Western Europe | 98.6 /100 | #75 | Exceptional 68.5% |
| Laotians | 98.6 /100 | #76 | Exceptional 68.5% |
| British | 98.6 /100 | #77 | Exceptional 68.5% |
| Danes | 98.6 /100 | #78 | Exceptional 68.5% |
| Greeks | 98.6 /100 | #79 | Exceptional 68.5% |
| Immigrants | Spain | 98.5 /100 | #80 | Exceptional 68.4% |
Demographics Similar to Immigrants from India by College, Under 1 year
In terms of college, under 1 year, the demographic groups most similar to Immigrants from India are Immigrants from Iran (74.3%, a difference of 0.23%), Immigrants from Taiwan (74.2%, a difference of 0.34%), Immigrants from Singapore (74.8%, a difference of 0.51%), Iranian (74.9%, a difference of 0.56%), and Okinawan (73.7%, a difference of 1.0%).
| Demographics | Rating | Rank | College, Under 1 year |
| Filipinos | 100.0 /100 | #1 | Exceptional 75.5% |
| Iranians | 100.0 /100 | #2 | Exceptional 74.9% |
| Immigrants | Singapore | 100.0 /100 | #3 | Exceptional 74.8% |
| Immigrants | India | 100.0 /100 | #4 | Exceptional 74.4% |
| Immigrants | Iran | 100.0 /100 | #5 | Exceptional 74.3% |
| Immigrants | Taiwan | 100.0 /100 | #6 | Exceptional 74.2% |
| Okinawans | 100.0 /100 | #7 | Exceptional 73.7% |
| Thais | 100.0 /100 | #8 | Exceptional 73.4% |
| Immigrants | Australia | 100.0 /100 | #9 | Exceptional 72.7% |
| Immigrants | Israel | 100.0 /100 | #10 | Exceptional 72.3% |
| Immigrants | South Central Asia | 100.0 /100 | #11 | Exceptional 72.1% |
| Immigrants | Sweden | 100.0 /100 | #12 | Exceptional 72.1% |
| Cypriots | 100.0 /100 | #13 | Exceptional 72.0% |
| Cambodians | 100.0 /100 | #14 | Exceptional 71.9% |
| Burmese | 100.0 /100 | #15 | Exceptional 71.9% |